| Pos. | Icon | Kurztext | Beschreibung |
|---|
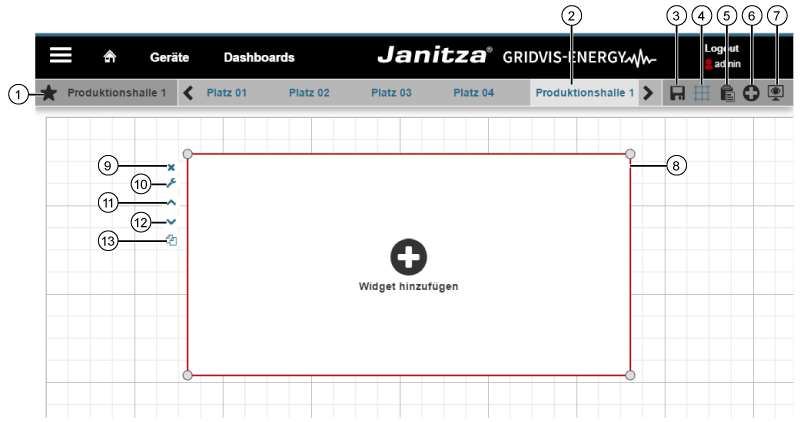
| 1 |  | Anzeige Favoriten | - Zeigt das gewählte Dashboard.
- Bei Favoriten-Dashboards erscheint das Icon vor dem Namen.
|
| 2 |
| Menüleiste Favoriten | - Zeigt die im Übersichtsfenster mit einem markierte Dashboards.
|
| 3 |  | Schaltfläche Dashboard speichern | - Speichert Änderungen am Dashboard.
- Erscheint nach Änderungen am Dashboard.
- Erscheint Blau, wenn Sie den Mauszeiger über das Symbol halten.
|
| 4 |  | Schaltfläche Raster anzeigen | - Aktiviert und deaktiviert das Raster.
- Erscheint Blau, bei aktiviertem Raster.
|
| 5 |  | Schaltfläche Zwischenablage einfügen | - Das zuvor in die Zwischenablage kopierte Widget (Pos.13) in das aktuelle Dashboard einfügen.
- Auf jedes Dashboard in der Dashboard-Übersicht anwendbar.
- Erscheint Blau, wenn Sie den Mauszeiger über das Symbol halten.
- Die Positionierung der Widgets auf dem Dashboard erfolgt mit dem Mauszeiger oder mit den Pfeiltasten der Tastatur.
|
| 6 |  | Schaltfläche Visualisierung hinzufügen (Widget hinzufügen) | - Erstellt einen Rahmen für Widgets auf dem Dashboard.
- Erscheint Blau , wenn Sie den Mauszeiger über das Symbol halten.
|
| 7 |  | Schaltfläche Dashboard anzeigen (Ansichtsmodus)
| - Wechsel in den Ansichtsmodus des Dashboards.
- Bei nicht gespeicherten Änderungen erscheint eine ja-/nein-Abfrage.
- Erscheint Blau, wenn Sie den Mauszeiger über das Symbol halten.
|
| 8 |
| Widget-Rahmen mit Eckpunkten | - Ein aktivierter Widget-Rahmen erscheint rot.
- Die Rahmenskalierung erfolgt, indem Sie bei gedrückter Maustaste die Eckpunkte auf die gewünschte Größe ziehen.
|
| 9 |  | Schaltfläche Visualisierung löschen | - Löscht den Widget-Rahmen (mit Inhalt).
|
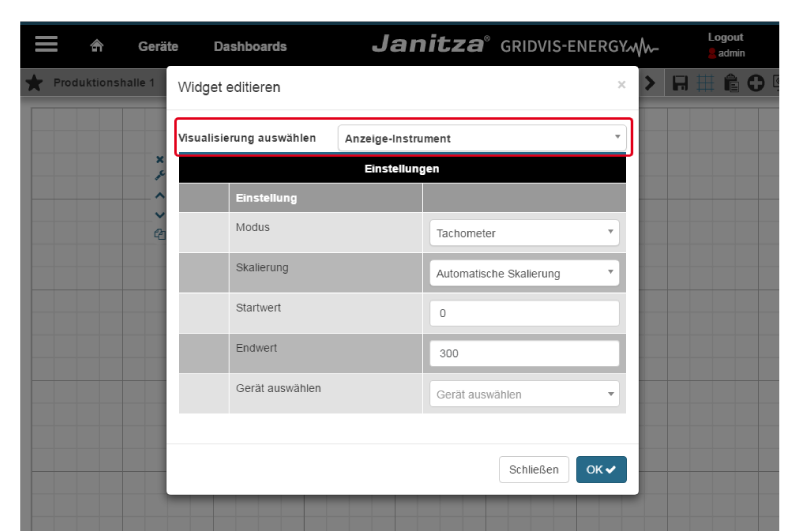
| 10 |  | Schaltfläche Visualisierung bearbeiten | - Öffnet zur Konfiguration von Widgets den Assistent Widget editieren.
|
| 11 |  | Schaltfläche Schrittweise nach vorne | - Bewegt Ihr Widget schrittweise eine Ebene nach vorne.
|
| 12 |  | Schaltfläche Schrittweise nach hinten | - Bewegt Ihr Widget schrittweise eine Ebene nach hinten.
|
| 13 |  | Schaltfläche Kopieren | - Kopiert das markierte Widget in den Zwischenspeicher.
- Über den Zwischenspeicher (Pos. 5 ) kopieren Sie das Widget in jedes Dashboard der Dashboard-Übersicht.
|