| Pos. | Texto breve | Descripción |
|---|
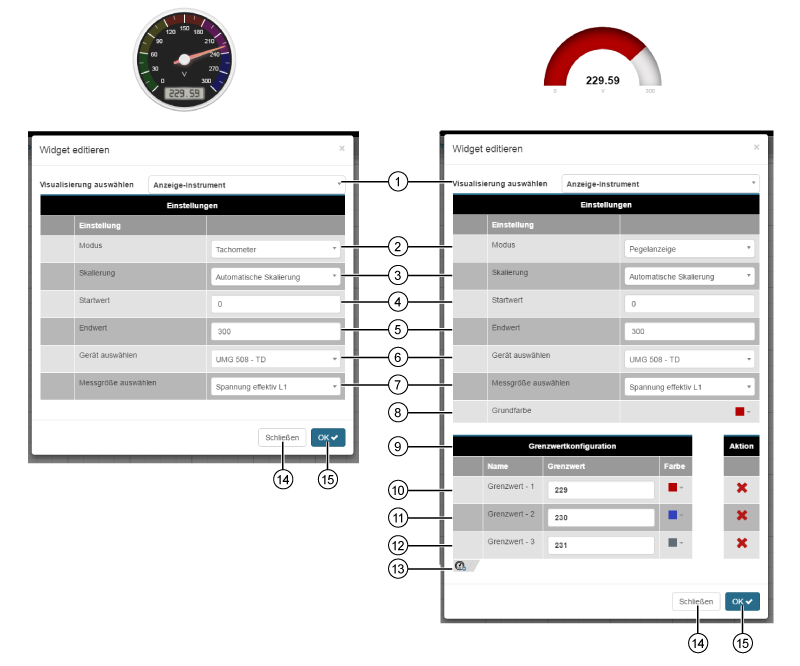
| 1 | Lista de selección «Seleccionar visualización» | - Elección del «widget» (de la visualización).
- «Instrumento de visualización» elegido.
|
| 2 | Lista de selección «Modo» | Dos modos a seleccionar: - Taquímetro
- Visualización de nivel
|
| 3 | Lista de selección «Escalado» | Pueden elegirse los siguientes ajustes en función de la magnitud de medición: - Escalado automático
- Ningún escalado
- Mili (m)
- Kilo (k)
- Mega (M)
- Giga (G)
|
| 4 | Campo de entrada «Valor de inicio» | Configuraciónde un valor de inicio para el widget. El valor de inicio = 0 para las siguientes entradas: - ninguna o
- entradas ininteligibles .
|
| 5 | Campo de entrada «Valor de finalización» | Configuraciónde un valor de finalización para el widget. El valor de finalización = valor de la primera solicitud para las siguientes entradas: - ninguna o
- entradas ininteligibles .
|
| 6 | Lista de selección «Seleccionar dispositivo» | - Elección del dispositivo.
- Incluye todos los dispositivos de su proyecto (vista general de dispositivos).
|
| 7 | Lista de selección «Seleccionar magnitud de medición» | - Lista de magnitudes de medición del dispositivo elegido anteriormente.
- El instrumento de visualización aparece al fondo en color «rojo» en caso de que la «Magnitud de medición no (esté) disponible» .
|
| Instrumento de visualización «Visualización de nivel» con configuración de valores de medición (cambio de color) |
|---|
| 8 | Selector de color «Color de fondo» (de base) | - Color de base de la visualización de nivel.
- Entrada RGB o hexadecimal.
- Control deslizante del espectro cromático.
- Sugerencia de color de los colores elegidos por última vez.
- Guarde su configuración de colores en el selector de color haciendo clic en el icono de guardado (
 ). ).
|
| 9 | Panel «Configuración de valores límite» | - Con las columnas «Nombre», «Valor límite», «Color» y «Acción».
- Columna «Nombre»: valor límite + cantidad.
- Introducción de hasta cinco valores límites.. Introduzca los valores límites en orden ascendente. (primer valor límite = valor más bajo / último valor límite = valor más alto). El sistema identifica las entradas incorrectas de los valores límites con el símbolo «
 ». Asegúrese de que, a partir de la entrada del segundo valor límite, el valor límite no sea igual o más bajo que el valor límite introducido anteriormente. ». Asegúrese de que, a partir de la entrada del segundo valor límite, el valor límite no sea igual o más bajo que el valor límite introducido anteriormente. - Entrada «Color» con introducción RGB o hexadecimal, control deslizante del espectro cromático y sugerencia de color de los colores elegidos por última vez.
- En la columna«Acción» puede eliminar valores límites haciendo clic en el botón «
 ». ».
|
| 10 | Campo de entrada «Valor límite 1» | - Introducción del primer valor límite.
- En función del ajuste de color, al alcanzar el primer valor límite cambia el color de la visualización de nivel (del color de base al color del primer valor límite).
- El sistema identifica las entradas incorrectas de los valores límites con el símbolo «». Para ver una descripción, mantenga el puntero del ratón sobre el símbolo.
- Asegúrese de que su valor límite no sea superior al «valor de finalización» .
|
| 11 | Campo de entrada «Valor límite 2» | - Introducción del segundo valor límite.
- En función del ajuste de color, al alcanzar el segundo valor límite cambia el color de la visualización de nivel (del color del primer valor límite al color del segundo valor límite).
- El sistema identifica las entradas incorrectas de los valores límites con el símbolo «». Para ver una descripción, mantenga el puntero del ratón sobre el símbolo.
- Asegúrese de que su valor límite no sea superior al «valor de finalización» ni igual o inferior al «valor límite 1» .
|
| 12 | Campo de entrada «Valor límite 3» | - Introducción del tercer valor límite.
- En función del ajuste de color, al alcanzar el tercer valor límite cambia el color de la visualización de nivel (del color del segundo valor límite al color del tercer valor límite).
- El sistema identifica las entradas incorrectas de los valores límites con el símbolo «». Para ver una descripción, mantenga el puntero del ratón sobre el símbolo.
- Asegúrese de que su valor límite no sea superior al «valor de finalización» ni igual o inferior al «valor límite 2» .
|
| 13 | Botón «Añadir valor límite» | - A la visualización de nivel del widget «Instrumento de visualización» se le añade un valor límite.
- Introducción de hasta cinco valores límites..
|
| 14 | Botón «Cerrar» | - Se cierra el asistente «Editar widget»sin guardar los datos introducidos.
|
| 15 | Botón «Aceptar» | - Se guarda su configuración.
- El «widget» aparece en el «panel».
|