Versionen im Vergleich

Schlüssel

  • Diese Zeile wurde hinzugefügt.
  • Diese Zeile wurde entfernt.
  • Formatierung wurde geändert.
Kommentar: Mittels Scroll Versions veröffentlicht aus dem Bereich GVH und Version 1.0.
Sv translation
languagede

Diese Seite beschreibt das Analysieren einzelner Ereignisse und Transienten mit dem Event Browser der Software GridVis. 

Bei Klick auf ein Element (Ereignis oder Transiente) der Listenansicht öffnet sich das Fenster Analysieren. Das Fenster Analysieren können Sie auch aus dem CBEMA-Graph öffnen. Beachten Sie, dass im CBEMA-Graph nur bestimmte Spannungsereignisse aufgeführt werden. 

 Das Fenster Analysieren besteht aus den folgenden drei Bereiche:

  • Kopfzeile (1): listet alle Eigenschaften des analysierten Elements auf . Die gezeigten Eigenschaften unterscheiden sich für Ereignisse und Transienten.
  • Seitenleiste (3):  Über die Registerkarten:
    • passen Sie die im Messwerte-Graph dargestellten Daten an.
    • ändern Sie die Darstellung  des Graphen. 
    • öffnen Sie die Historie.
  • Messwerte-Graph (2) / CBEMA-Kurve: Im Messwert-Graph (2) werden die zum Ereignis aufgezeichneten Messwerte dargestellt. Hier können Sie je nach Gerät und Konfiguration zwischen Effektivwert und Vollwelle wählen. Über die Gerätehistorie öffnen Sie einen Gerätespezifischen CBEMA-Graphen.

Anker
AnalysierenIMG
AnalysierenIMG

Panel
borderWidth0
titleInhalt

Inhalt
maxLevel2


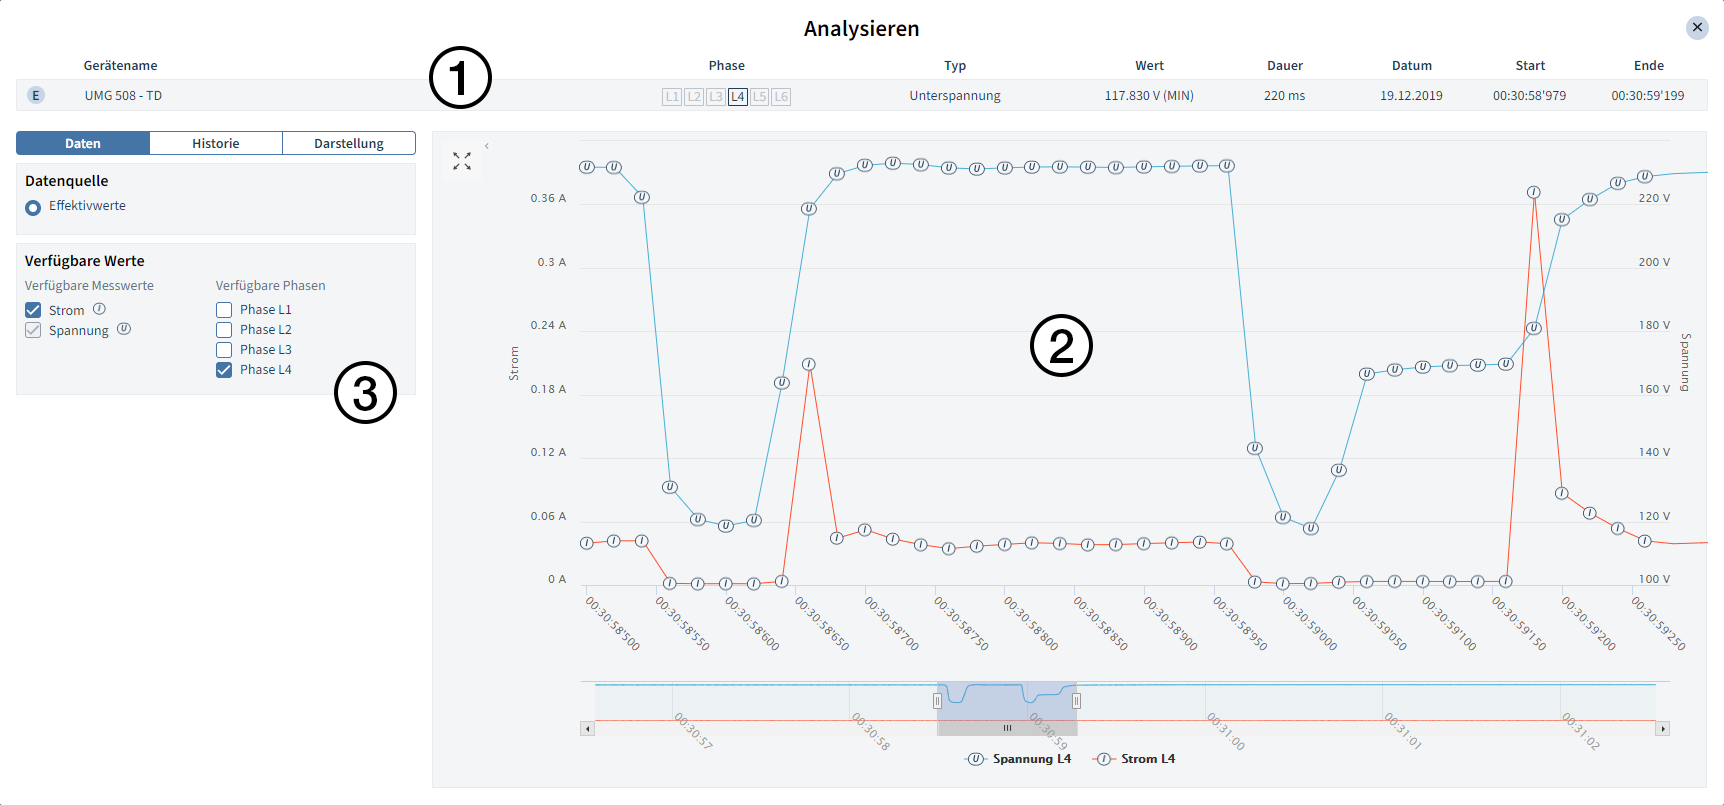
Abb. 1: Ereignis analysieren


Handlungsoptionen

  • Über die Miniatur-Ansicht und die Schieberegler unterhalb des Messwert-Graphen passen Sie den angezeigten Bereich an.
  • Sie können einen Bereich des Graphen über das Mausrad, das Aufziehen eines Fensters mit der Maus oder den Zweifinger-Zoom (Tablet) vergrößern.
  • Über die Registerkarten der Seitenleiste (3) öffnen Sie die Historie und passen die Darstellung des Messwerte-Graphen an.


Anker
Daten
Daten
Daten

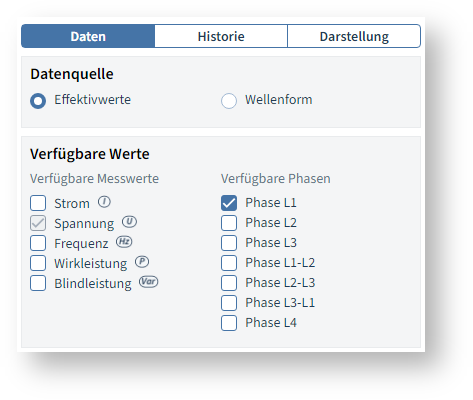
Wählen Sie die Datenquelle für den Messwert-Graph und fügen dem Graph weitere Messwerte und Phasen hinzu. 

  • Datenquelle: Die Datenquelle bestimmt ob Effektivwerte oder Vollwellen dargestellt werden. Die Optionen hängen von Gerät, Aufzeichnungskonfiguration und Ereignistyp ab
  • Verfügbare Werte: Die verfügbaren Messwerte und Phasen hängen von Gerät und Aufzeichnungskonfiguration ab. 

Abb. 2: Registerkarte Daten


Anker
Historie
Historie
Historie

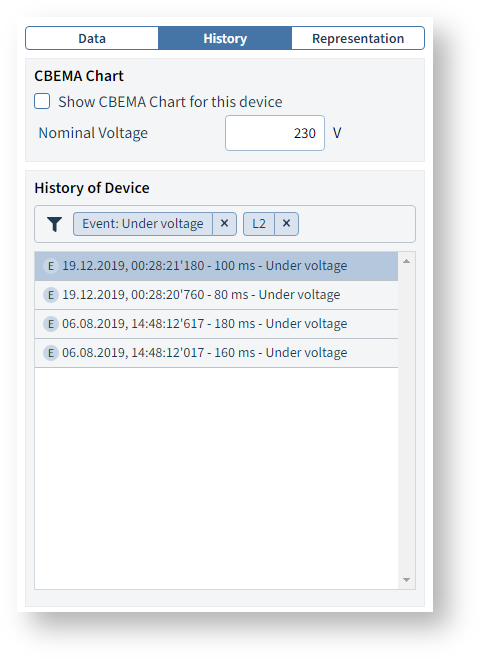
Enthält eine Liste aller vom gleichen Gerät aufgezeichneten Ereignisse und Transienten (Gerätehistorie).  Über die Historie öffnen Sie einen CBEMA-Graphen für das entsprechende Gerät. 

CBEMA-Graph 

Durch aktivieren der Checkbox, öffnen Sie einen CBEMA-Graphen für die Spannungsereignisse des ausgewählten Gerätes. Über das Eingabefeld passen Sie die Nominalspannung an, die als Referenzpunkt für den Graphen dient.

Gerätehistorie  

Falls Filter aktiv sind, werden diese in der Kopfzeile der Gerätehistorie aufgelistet und können hier entfernt oder durch Klick temporär deaktiviert werden. 

Über Klick auf ein Element aus der Liste wird dieses ausgewählt und in der Kopfzeile (Abb.1 1) und dem Messwerte- oder CBEMA-Graphen angezeigt. 

Drehstromereignis

Manche Messgeräte zeichnen zusätzlich zu den Einzelphasen-Ereignissen auch so genannte Drehstromereignisse auf. Tritt ein Ereignis in allen drei Phasen auf, werden diese drei Ereignisse in einem Drehstromereignis zusammengefasst.

  • Drehstromereignisse erkennen Sie an der roten Umrandung um das Ereignis-Icon. 
  • Drehstromereignisse nicht im CBEMA-Graphen berücksichtigt.

Abb. 4: Main Event 


Abb. 3: Registerkarte Historie


Anker
Darstellung
Darstellung
Darstellung

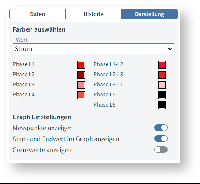
Über diesen Reiter passen Sie die Darstellung des Messwert-Graphen an.

  • Farben auswählen: Über die Dropdown-Schaltfläche wählen Sie den zu konfigurierenden Messwert und über die Farbfelder passen Sie dessen farbliche Darstellung im Messwert-Graphen an.
  • Graph-Einstellungen: Über die Schalter aktivieren/deaktivieren Sie graphische Elemente wie die Anzeige der Messpunkte und das einblenden einer horizontalen Linie für den GrenzwertDie Optionen hängen von Konfiguration und Gerät ab.

Abb. 5: Darstellung

Sv translation
languageen

This page describes how to analyze individual events and transients with the Event Browser of GridVis software. 

When you click on an element (event or transient) in the List view, the Analyze window opens. You can also open the Analyze window from the CBEMA chart. Note that only certain voltage events are listed in the CBEMA chart. 

 The Analyze window consists of the following three areas:

  • Header (1): lists all properties of the analyzed element. The displayed properties differ for events and transients.
  • Sidebar (3):  You use the tabs to do the following:
    • Adjust the  DatenData displayed in the measure value chart.
    • Change the DarstellungRepresentation  of the chart.
    • Open the HistorieHistory.
  • Measure value chart (2) / CBEMA curve: The measure value chart (2) shows the measure values recorded for the event. You can choose between effective value and full wave here depending on the device and configuration. You use the History of Device to open a device-specific CBEMA chart.

Anker
Analyzing
Analyzing

Panel
borderWidth0
titleContent

Inhalt
maxLevel2


Fig. 1: Analyzing event


Operational options

  • You use the Thumbnail view and sliders below the measure value chart to adjust the displayed area.
  • You can zoom in on an area of the chart via the mouse wheel, dragging a window with the mouse or by zooming in using two fingers (tablet).
  • Use the tabs of the sidebar (3) to open the history and adjust the representation of the measure value chart.


Anker
Data
Data
Data

Select the data source for the measure value chart and add more measure values and phases to the chart. 

  • Data source: The data source determines whether effective values or full waves are represented. The options depend on the device, recording configuration and event type
  • Available values: The available measure values and phases depend on the device and recording configuration. 

Fig. 2: Data tab


Anker
History
History
History

Contains a list of all events and transients recorded by the same device (History of Device).  You use History to open a CBEMA chart for the corresponding device. 

CBEMA Chart 

By activating the checkbox, you open a CBEMA chart for the voltage events of the selected device. You use the input field to adjust the nominal voltage that serves as the reference point for the chart.

History of Device  

If filters are active, they are listed in the header of the History of Device and can be removed here or temporarily deactivated by clicking on them. 

By clicking on an element from the list, it is selected and displayed in the header (Fig.1 1) and in the measure value or CBEMA chart. 

Three-phase event

Some measurement devices also record three-phase events in addition to the single-phase events. If an event occurs in all three phases,  these three events are combined into a three-phase event.

  • Three-phase events can be identified by the red border around the event icon. 
  • Three-phase events are not included in the CBEMA chart.

Fig. 4: Main event 


Fig. 3: History tab


Anker
Representation
Representation
Representation

You use this tab to adjust the representation of the measure value chart.

  • Select colors: Use the drop-down button to select the measure value to be configured and use the color fields to adjust its color representation in the measure value chart.
  • Chart settings: Use the switches to activate/deactivate chart elements such as displaying the measurement points and displaying a horizontal line for the limit valueThe options depend on the configuration and the device.

Fig. 5: Representation

Sv translation
languagees

Esta página describe el análisis de eventos y transitorios individuales con el navegador de eventos del software GridVis. 

Haciendo clic en un elemento (evento o transitorio) de la vista de lista se abre la ventana Analizar. También podrá abrir la ventana Analizar desde el gráfico CBEMA. Tenga en cuenta que en el gráfico CBEMA solamente se representan determinados eventos de tensión. 

 La ventana Analizar se compone de las siguientes tres áreas:

  • Encabezado (1): relaciona todas las propiedades del elemento analizado. Las propiedades mostradas difieren para los eventos y transitorios.
  • Barra lateral (3):  a través de las fichas:
    • Podrá adaptar los Daten representados en el gráfico de valores de medición.
    • Podrá cambiar la Darstellung  del gráfico. 
    • Podrá abrir la Historie.
  • Gráfico de valores de medición (2) / curva CBEMA: en el gráfico de valores de medición (2) se representan los valores de medición registrados acerca del evento. En función del dispositivo y de la configuración, aquí podrá seleccionar entre valor efectivo y onda completa. A través de la historia del dispositivo podrá abrir un gráfico CBEMA específico del dispositivo.

Anker
AnalizarIMG
AnalizarIMG

Panel
borderWidth0
titleContenido

Inhalt
maxLevel2


Fig. 1: Analizar evento


Opciones de acción

  • A través de la vista miniatura y los controles deslizantes situados debajo del gráfico de valores de medición podrá adaptar el área visualizada.
  • Podrá ampliar un área del gráfico mediante la rueda del ratón, abriendo una ventana con el ratón o haciendo zoom con dos dedos (tableta).
  • A través de las fichas de la barra lateral (3) podrá abrir la historia y adaptar la representación del gráfico de valores de medición.


Anker
Datos
Datos
Datos

Seleccione el origen de los datos para el gráfico de valores de medición y agregue valores de medición y fases adicionales al gráfico. 

  • Origen de datos: el origen de datos determina si se representan valores efectivos u ondas completas. Las opciones dependen del dispositivo, de la configuración de registro y del tipo de evento
  • Valores disponibles: los valores de medición y las fases disponibles dependen del dispositivo y de la configuración de registro. 

Fig. 2: Ficha “Datos”


Anker
Historia
Historia
Historia

Contiene una lista de todos los eventos y transitorios registrados por el mismo dispositivo (historia del dispositivo).  A través de la historia podrá abrir un gráfico CBEMA para el dispositivo correspondiente. 

Gráfico CBEMA 

Activando la casilla de verificación podrá abrir un gráfico CBEMA para los eventos de tensión del dispositivo seleccionado. A través del campo de entrada podrá adaptar la tensión nominal que se utiliza como punto de referencia para el gráfico.

Historia del dispositivo  

Si hay filtros activados, estos se relacionan en el encabezado de la historia del dispositivo, donde podrán eliminarse o desactivarse temporalmente con un clic. 

Haciendo clic en un elemento de la lista, este se selecciona y se muestra en el encabezado (Fig. 1 1) y en el gráfico de valores de medición o en el gráfico CBEMA. 

Evento de corriente trifásica

Algunos dispositivos de medición también registran los denominados eventos de corriente trifásica, además de los eventos de las fases individuales. Si se produce un evento en las tres fases, estos tres eventos se resumen en un evento de corriente trifásica.

  • Los eventos de corriente trifásica pueden reconocerse por el borde rojo alrededor del icono de eventos. 
  • Los eventos de corriente trifásica no se tienen en cuenta en el gráfico CBEMA.

Fig. 4: Evento principal 


Fig. 3: Ficha “Historia”


Anker
Representación
Representación
Representación

A través de esta pestaña podrá adaptar la representación del gráfico de valores de medición.

  • Seleccionar colores: A través del botón desplegable podrá seleccionar el valor de medición que desee configurar, y a través de los campos de colores podrá adaptar su color de representación en el gráfico de valores de medición.
  • Ajustes del gráfico: A través de los conmutadores podrá activar y desactivar los elementos gráficos, tales como la visualización de los puntos de medición y de una línea horizontal para el valor límiteLas opciones dependen de la configuración y del dispositivo.

Fig. 5: Representación

Sv translation
languageit

In questa pagina viene descritto come analizzare singoli eventi e transitori con Event-Browser del software GridVis. 

Facendo clic su un elemento (evento o transitorio) della vista elenco si apre la finestra Analizza. È anche possibile aprire la finestra Analizza dal grafico CBEMA. Si noti che solo alcuni eventi di tensione sono elencati nel grafico CBEMA. 

 La finestra Analizza è composta dalle seguenti tre aree:

  • Intestazione (1): elenca tutte le proprietà dell’elemento analizzato. Le proprietà mostrate differiscono per gli eventi e i transitori.
  • Barra laterale (3):  Tramite le schede:
    • è possibile regolare i valori indicati nel grafico delle letture. Daten .
    • modificare la Darstellung  del grafico. 
    • aprire la Historie.
  • Grafico letture (2) / Curva CBEMA: Le letture registrate per l’evento vengono mostrate nel grafico delle letture (2). Qui è possibile scegliere tra valore effettivo e onda piena, a seconda del dispositivo e della configurazione. Tramite la Cronologia del dispositivo aprire un grafico CBEMA specifico per il dispositivo.

Anker
AnalysierenIMG
AnalysierenIMG

Panel
borderWidth0
titleContenuto

Inhalt
maxLevel2


Fig. 1: Analizzare l’evento


Opzioni di intervento

  • Utilizzare la vista in miniatura e i cursori sotto il grafico delle letture per regolare l’area visualizzata.
  • È possibile ingrandire un’area del grafico utilizzando la rotella del mouse, trascinando una finestra con il mouse o con lo zoom a due dita (tablet).
  • Utilizzare le schede della barra laterale (3) per aprire la cronologia e regolare la visualizzazione del grafico delle letture.


Anker
Daten
Daten
Dati

Selezionare l’origine dei dati del grafico delle letture e aggiungere al grafico altre letture e fasi. 

  • Origine dei dati: L’origine dei dati determina se vengono visualizzati i valori efficaci o le onde intere. Le opzioni dipendono dal dispositivo, dalla configurazione della registrazione e dal tipo di evento
  • Valori disponibili: Le letture e le fasi disponibili dipendono dal dispositivo e dalla configurazione della registrazione. 

Fig. 2: Scheda Dati


Anker
Historie
Historie
Cronologia

Contiene un elenco di tutti gli eventi e i transitori registrati dallo stesso dispositivo (Cronologia del dispositivo).  Utilizzare la cronologia per aprire un grafico CBEMA per il dispositivo corrispondente. 

Grafico CBEMA 

Attivando la casella di controllo, si apre un grafico CBEMA per gli eventi di tensione del dispositivo selezionato. Utilizzare il campo di immissione per regolare la tensione nominale, che funge da punto di riferimento per il grafico.

Cronologia del dispositivo

Se Filtro sono attivi, vengono elencati nell’intestazione della cronologia del dispositivo e possono essere rimossi o temporaneamente disattivati facendovi clic. 

Facendo clic su un elemento dell’elenco, lo stesso viene selezionato e visualizzato nell’intestazione (Fig.1 1) e vengono visualizzati il grafico delle letture o il grafico CBEMA. 

Evento trifase

Alcuni strumenti di misura registrano anche i cosiddetti eventi trifase oltre a quelli monofase. Se un evento si verifica in tutte e tre le fasi, questi tre eventi vengono combinati in un unico evento trifase.

  • Gli eventi trifase si riconoscono dal bordo rosso intorno all’icona dell’evento. 
  • Eventi trifase non inclusi nel grafico CBEMA.

Fig. 4: Main Event 


Fig. 3: Scheda Cronologia


Anker
Darstellung
Darstellung
Visualizzazione

Utilizzare questa scheda per regolare la visualizzazione del grafico delle letture.

  • Selezionare i colori: Usare il pulsante a discesa per selezionare il valore misurato da configurare e usare i campi colore per regolare la sua rappresentazione cromatica nel grafico delle letture.
  • Impostazioni del grafico: Utilizzare i pulsanti per attivare/disattivare elementi grafici come la visualizzazione dei punti di misura e la visualizzazione di una linea orizzontale per la sogliaLe opzioni dipendono dalla configurazione e dal dispositivo.

Fig. 5: Visualizzazione