Versionen im Vergleich

Schlüssel

  • Diese Zeile wurde hinzugefügt.
  • Diese Zeile wurde entfernt.
  • Formatierung wurde geändert.
Kommentar: Mittels Scroll Versions veröffentlicht aus dem Bereich GVH und Version 1.0.
Sv translation
languagede

Anker
oben
oben


Beschreibung

Energiewerte können wichtige Referenzdaten für Ihre Energiekosten und Ihren Energieverbrauch liefern. Nachfolgend ist als Beispiel für den CSV-Import von Energiedaten ein Daten-Import Bezogene Wirkarbeit in die GridVis aufbereitet:

  • Konfigurieren Sie zunächst Ihr Gerät für den Daten-Import (DI) wie unter Daten-Import (DI) - Konfiguration beschrieben.
  • Folgen Sie danach der beispielhaften Konfiguration.

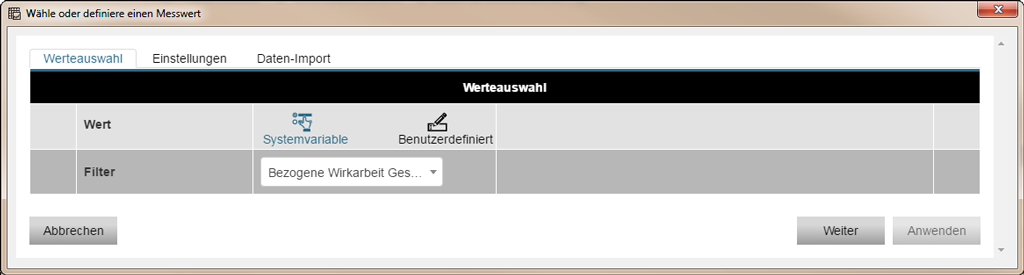
Abb.: Beispiel-Konfiguration eines CSV-Daten-Imports - 1. Register Werteauswahl


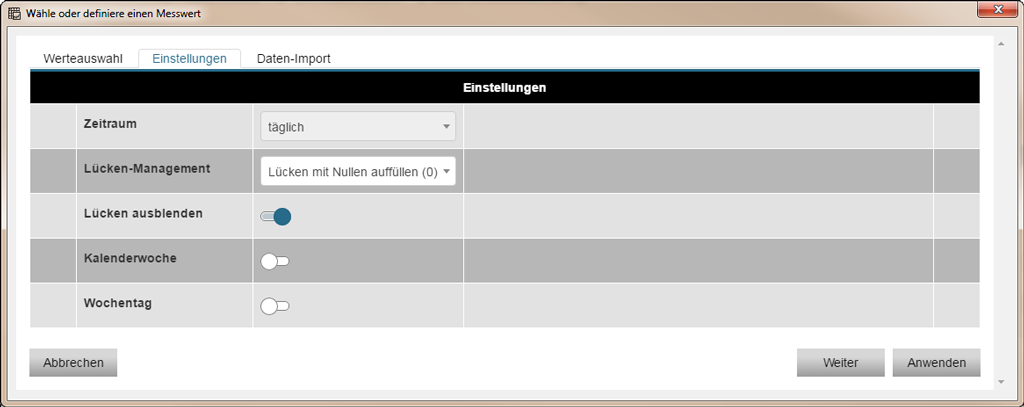
Abb.: Beispiel-Konfiguration eines CSV-Daten-Imports - 2. Register Einstellungen


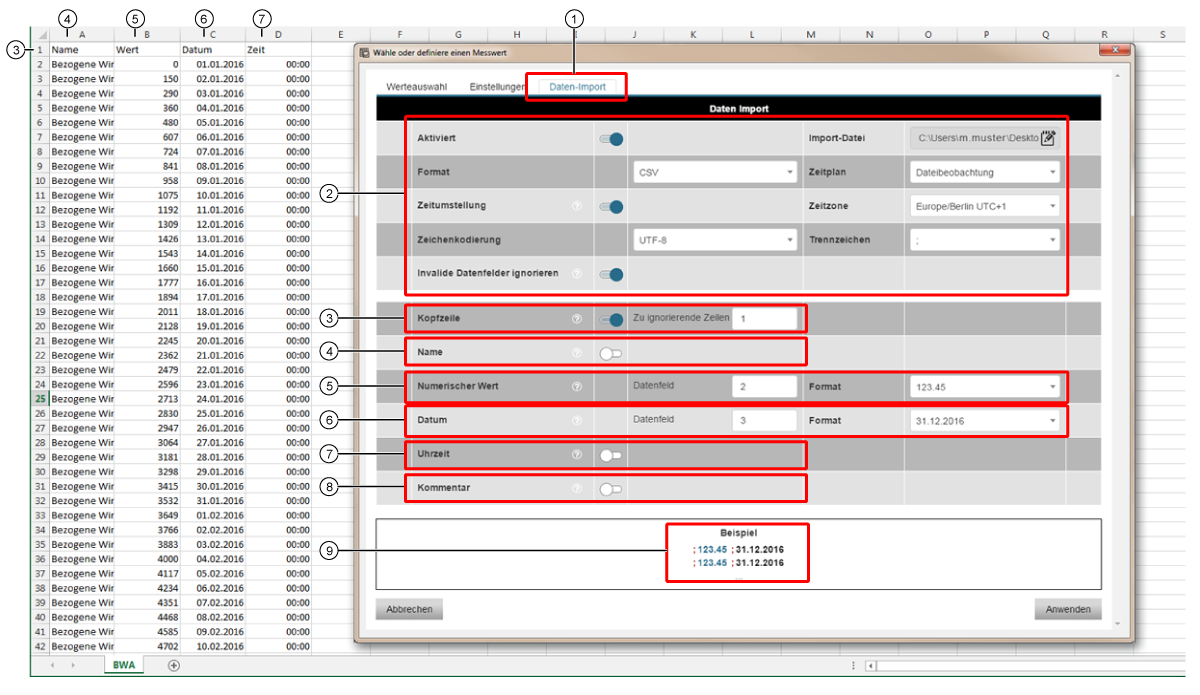
Abb.: Beispiel-Konfiguration eines CSV-Daten-Imports - 3. Register Einstellungen


Pos.Einstellungen der Parameter im Daten-ImportBeschreibung der CSV-Datei Formatierung
13. Register Daten-Import - zum aktivieren auf das Register klicken.

2

Konfigurieren Sie im Bereich Daten-Import die Parameter/Funktionen wie oben dargestellt.

3

Kopfzeile:

  • Schieberegler --> on
  • Eingabefeld Zu ingnorierende Zeilen --> 1
  • Da die Zu ignorierenden Zeilen den Wert 1 haben, werden die Kopfzeilen-Einträge Name, Datum, Zeit, Wert nicht eingelesen.
4Name --> Schieberegler off
  • Der Name (Bezogene Wirkarbeit) wird nicht eingelesen.
5

Nummerischer Wert:

  • Datenfeld 2
  • Format 123.45
  • Der Nummerische Wert steht in Spalte 2 (Datenfeld 2) der CSV-Datei.
6

Datum:

  • Datenfeld 3
  • Format 31.12.2016
  • Das Datum steht in Spalte 3 (Datenfeld 3) der CSV-Datei.
7Uhrzeit --> Schieberegler off
  • Die Uhrzeit wird nicht eingelesen.
8Kommentar --> Schieberegler off
  • Die CSV-Datei enthält keinen Kommentar. Der Kommentar wird nicht eingelesen.
9Formatierung --> Anzeige Beispiel
  • Die Spalten 2 und 3 werden eingelesen.
  • Alle Spalten sind durch Semikolons getrennt.

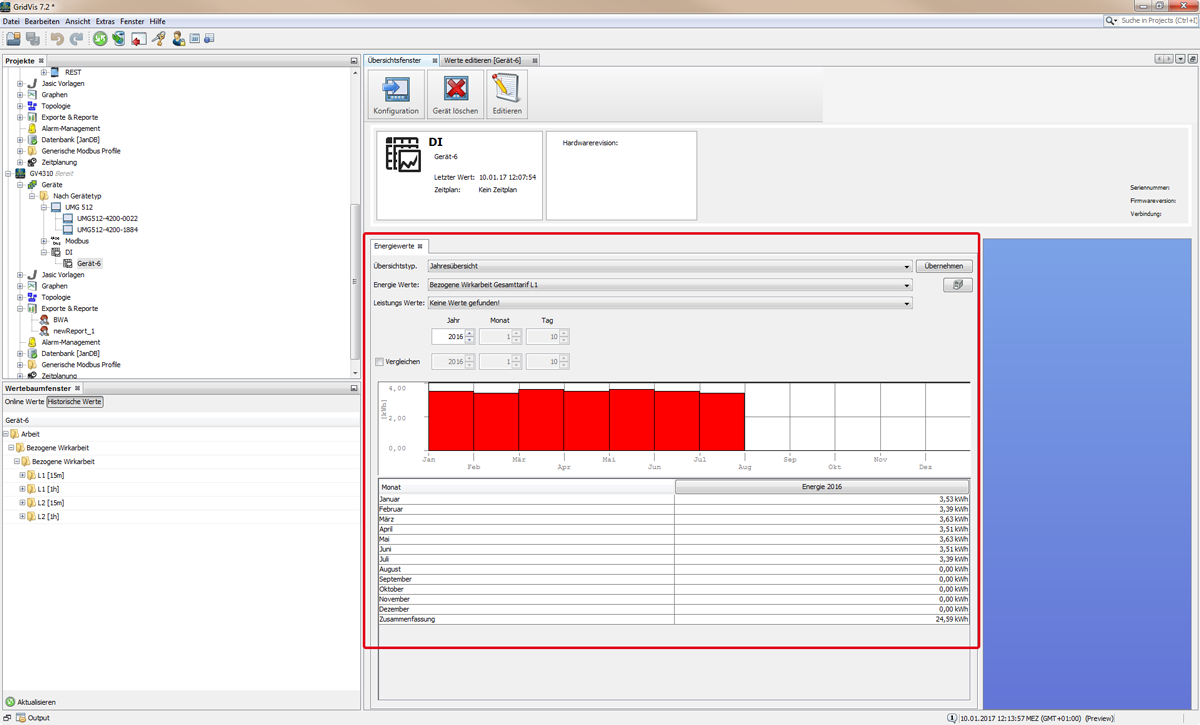
Klicken Sie zum Abschluß die Schaltfläche Anwenden, um Ihre Konfiguration einzulesen.


Für eine Auswertung Ihrer Daten verfügt die Software-GridVis über 3 Darstellungsformen:

I. Auswertung im Übersichtsfenster

I. Abb.: Ergebnis im Übersichtsfenster

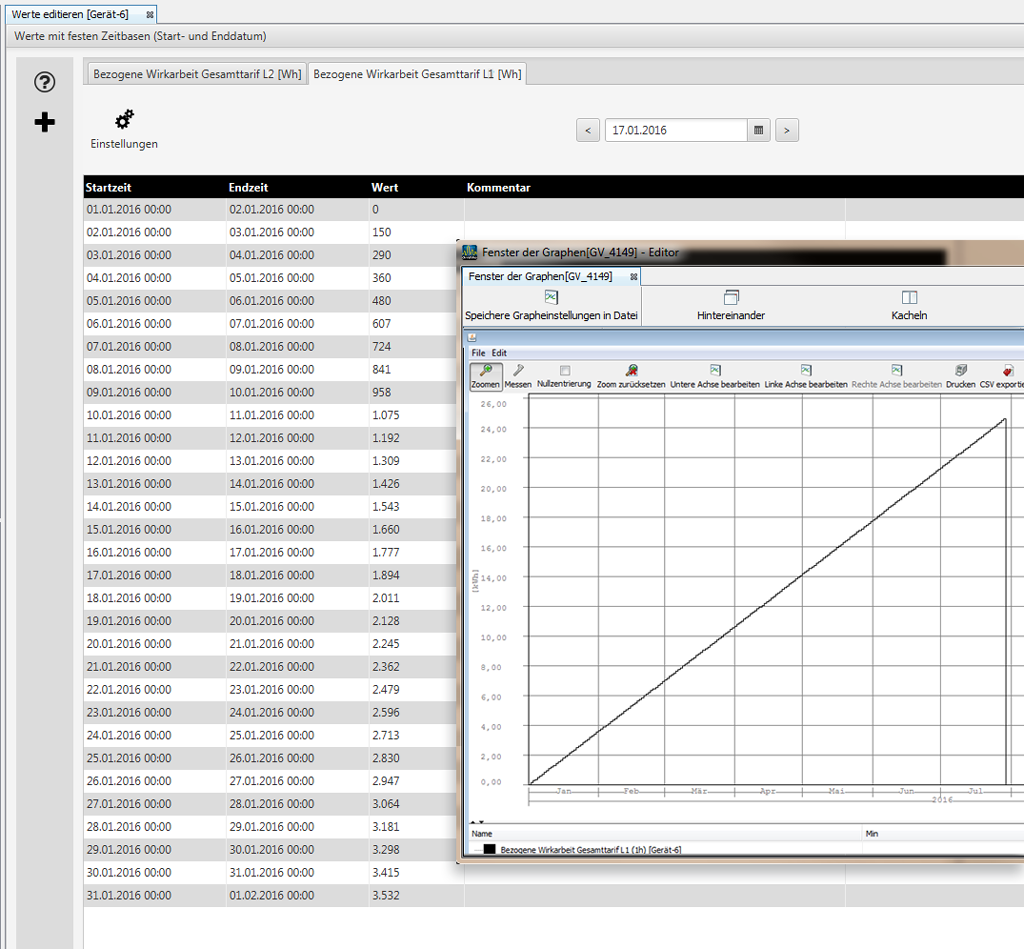
2. Auswertung im Fenster des Graphen

  • Öffnen Sie im Wertebaumfenster Ihre historischen Werte.
  • Klicken Sie mit der rechten Maustaste auf Ihren Wert.
  • Wählen Sie im Kontextmenü den Eintrag Im Graphen anzeigen.
  • In der Symbolleiste des Graphen stehen Ihnen weitere Analyse-Funktionen zur Verfügung.

2. Abb.: Ergebnis im Fenster des Graphen


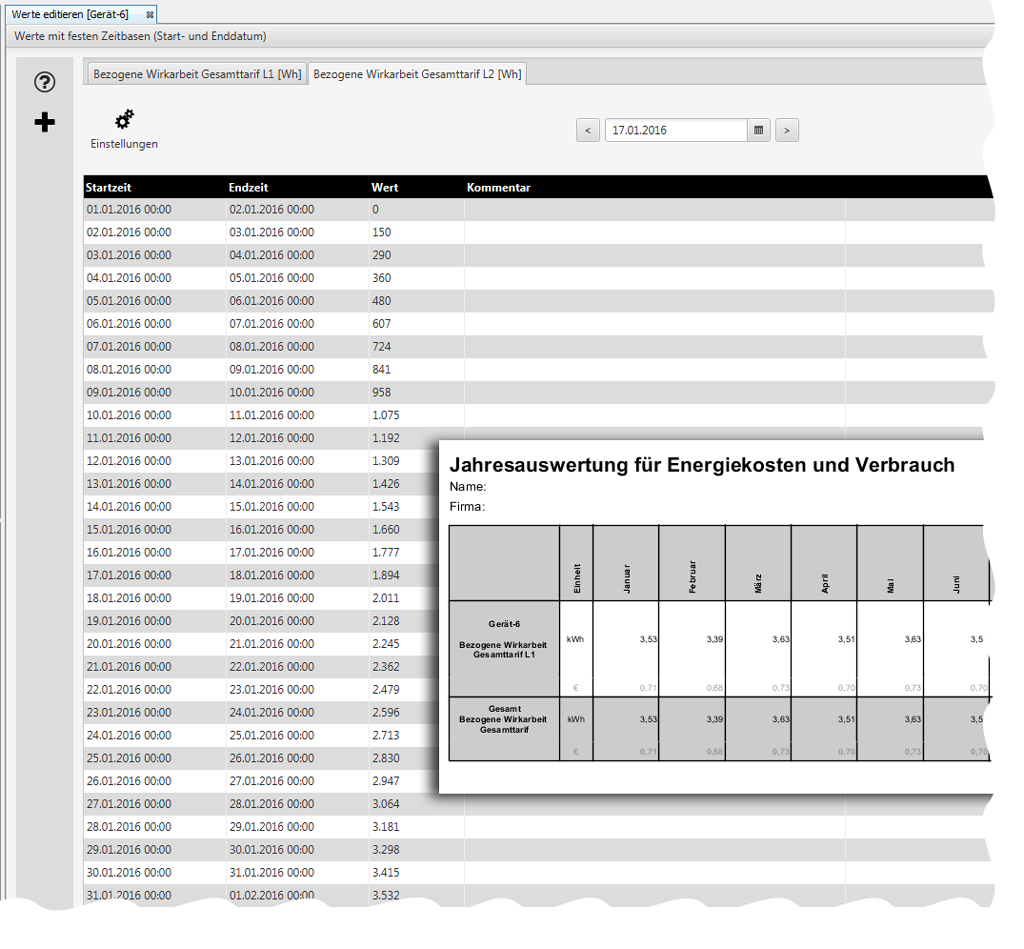
3. Jahresauswertung für Energiekosten und Verbrauch über die Funktion Exporte & Reporte der Software GridVis (Desktop):

  • Wählen Sie unter Exporte & Reporte im Projekte-Fenster Ihrer GridVis mit der rechten Maustaste den Kontextmenü-Eintrag Neuen Report erstellen.
  • Klicken Sie im Fenster Wähle einen Report den Eintrag Jahresauswertung für Energiekosten und Verbrauch.
  • Ein Assistent führt Sie durch die weitere Konfiguration Ihres Reports.
  • Für die Ausgabe Ihrer Jahresauswertung stellt Ihnen die Software GridVis verschiedene Dateitypen (pdf, odt, html, xls) zur Verfügung.

3. Abb.: Ergebnis als Report über die Funktion Jahresauswertung für Energiekosten und Verbrauch


Sv translation
languageen

Anker
oben
oben


Description

Energy values can provide important reference data for your energy costs and your energy consumption. The following is a data import "Active energy drawn" prepared in GridVis as an example for the CSV import of energy data:

Fig.: Example configuration of a CSV data import - First register "Value Selection"


Fig.: Example configuration of a CSV data import - Second register "Settings"


Fig.: Example configuration of a CSV data import - Third register "Settings"

Pos.Parameter settings in the "Data Import"Description of the "CSV File" formatting
1Third register "Data Import" -click on the register to activate it.
 
2

Configure the parameters/functions in the data import area as described above.

3

"Header":

  • Slider --> "on"
  • Entry field "Rows to be ignored" --> "1"
  • Because the "Rows to be ignored" has the value "1," the header entries "Name, Date, Time, Value" will not be read.
4"Name" --> Slider "off"
  • The "Name" (Active energy drawn) isnot read.
5

"Numerical Value":

  • Data field "2"
  • Format"123.45"
  • The"Numerical Value" is in the column "2"(Data field "2") of the CSV file.
6

"Date":

  • Data field "3"
  • Format"31.12.2016"
  • The"Date" is in the column "3" (Data field "3")of the CSV file.
7"Time" --> Slider "off"
  • The "Time" isnot read.
8"Comment" --> Slider "off"
  • The CSV file does not contain a "Comment." The "Comment isnot read.
9"Formatting" --> Display"Example"
  • The columns "2" and "3" are not read.
  • All columns are separated by semicolons.

Finally click on the button "Apply"to read in your configuration.


To analyze your data, the GridVis software has 3 ways of interpreting it:

1. Interpretation in the "Overview Window"

1. Fig.: "Result" in the overview window

2. Interpretation in the "Window of the Graph"

  • Open your "Historical Values" in the value tree window.
  • Right-click on your value.
  • Select the entry "Display in Graph" in the context menu.
  • More analysis functions are available to you in the symbol bar of the graph.

2. Fig.: "Result" in the graph window


3. Annual evaluation of the energy costs and consumption using the function "Exports & Reports"in the GridVis software (desktop):

  • In "Exports & Reports" in your GridVis project window, right-click on the context menu entry"Create New Report."
  • In the window "Select a Report" click on the entry "Annual Analysis of the Energy Costs and Consumption."
  • An assistant will guide you through the further configuration of your report.
  • For the output of yourannual analysis, the GridVis software can provide several different file types (pdf, odt, html, xls).

3. Fig.: "Result" as a report via the function "Annual Analysis of the Energy Costs and Consumption"


Sv translation
languagees

Anker
oben
oben


Descripción

Los valores de energía pueden proporcionar datos de referencia importantes para sus costes y consumo de energía. A continuación se muestra un ejemplo de importación CSV de datos de energía; para ello, se ha preparado en GridVis una importación de datos de «energía activa consumida»:

Fig.: configuración de ejemplo para una importación de datos CSV; primera pestaña: «Selección de valores»


Fig.: configuración de ejemplo para una importación de datos CSV; segunda pestaña: «Ajustes»


Fig.: configuración de ejemplo para una importación de datos CSV; tercera pestaña: «Ajustes»


Pos.Ajustes de los parámetros en la «importación de datos»Descripción del formato del «archivo CSV»
1Tercera pestaña («Importación de datos»);haga clic en la pestaña para activarla
 
2

En el panel de importación de datos, configure los parámetros o funciones como se muestra arriba.

3

«Encabezado»:

  • Control deslizante --> «on»
  • Campo de entrada «Filas a ignorar» --> «1»
  • Debido a que las «filas a ignorar» tienen el valor «1», no se cargan las entradas del encabezado «Nombre», «Fecha», «Hora» y «Valor».
4«Nombre» --> control deslizante «off»
  • El «nombre» (energía activa consumida)no se carga.
5

«Valor numérico»:

  • Campo de datos «2»
  • Formato«123.45»
  • El«valor numérico» se encuentra en la columna «2»(campo de datos «2») del archivo CSV.
6

«Fecha»:

  • Campo de datos «3»
  • Formato«31.12.2016»
  • La«fecha» se encuentra en la columna «3» (campo de datos «3»)del archivo CSV.
7«Hora» --> control deslizante «off»
  • La «hora »no se carga.
8«Comentario» --> control deslizante «off»
  • El archivo CSV no contiene ningún «comentario». El «comentario »no se carga.
9«Formato» --> Visualización«Ejemplo»
  • Las columnas «2» y «3» no se cargan.
  • Todas las columnas están separadas con punto y coma.

Para finalizar, haga clic en el botón «Aplicar»para cargar su configuración.


Para evaluar sus datos, el software GridVis dispone de tres formas de visualización:

1. Evaluación en la «ventana de vista general»

1. Fig.: «resultado» en la ventana de vista general

2. Evaluación en la «ventana de la gráfica»

  • Abra sus «valores del historial» en la ventana del árbol de valores.
  • Haga clic con el botón derecho del ratón en su valor.
  • Elija el elemento «Mostrar en la gráfica» del menú contextual.
  • Usted dispone de más funciones de análisis en la barra de herramientas de la gráfica.

2. Fig.: «resultado» en la ventana de la gráfica


3. Evaluación anual de los costes de energía y el consumo mediante la función «Exportaciones e informes»del software GridVis (Desktop):

  • En «Exportaciones e informes» de la ventana de proyectos de su GridVis, haga clic con el botón derecho del ratón en el elemento del menú contextual«Crear nuevo informe».
  • En la ventana «Elegir un informe», haga clic en la entrada «Evaluación anual de los costes de energía y el consumo».
  • Un asistente le guiará a lo largo de los siguientes pasos de configuración de su informe.
  • Para exportar suevaluación anual, el software GridVis le proporciona diferentes tipos de archivos (pdf, odt, html, xls).

3. Fig.: «resultado» como informe mediante la función «Evaluación anual de los costes de energía y el consumo»


Sv translation
languageit

Anker
oben
oben


Descrizione

I valori energetici possono fornire importanti dati di riferimento per i costi e i consumi energetici. Di seguito è riportato un esempio di importazione di dati energetici in formato CSV, ovvero l’importazione dei dati di “Energia attiva consumata“ in GridVis:

Fig.: Esempio di configurazione di un’importazione di dati CSV - 1. Scheda “Seleziona valori“


Fig.: Esempio di configurazione di un’importazione di dati CSV - 2. Scheda “Impostazioni“


Fig.: Esempio di configurazione di un’importazione di dati CSV - 3. Scheda “Impostazioni“


Pos.Impostazioni dei parametri in “Importazione dati”Descrizione della formattazione del “file CSV“
13. Scheda “Importazione dati“ - Fare clic sulla scheda da attivare.

2

Nella sezione Importazione dati, configurare i parametri/funzioni come indicato sopra.

3

“Intestazione“:

  • Cursore --> “on“
  • Campo “Righe da ignorare” --> “1”
  • Dal momento che le “Righe da ignorare“ presentano il valore “1“, le voci di intestazione “Nome, Data, Ora, Valore“ non vengono mappate.
4“Nome“ --> Cursore “off“
  • Il “Nome“ (Energia attiva consumata) non viene mappato.
5

“Valore numerico“:

  • Campo dati “2“
  • Formato “123.45“
  • Il “Valore numerico“ si trova nella colonna “2“ (Campo dati “2“) del file CSV.
6

“Data“:

  • Campo dati “3“
  • Formato “31.12.2016“
  • La “Data“ si trova nella colonna “3“ (Campo dati “3“) del file CSV.
7“Ora“ --> Cursore “off“
  • L’“Ora“ non viene mappata.
8“Commento“ --> Cursore “off“
  • Il file CSV non contiene nessun “Commento“. Il “Commento“ non viene mappato.
9“Formattazione“ --> Schermata “Esempio“
  • Le colonne “2“ e “3“ vengono mappate.
  • Tutte le colonne sono separate da un punto e virgola.

Per terminare, fare clic sul pulsante “Applica“, per mappare la configurazione.


Per una valutazione dei dati, il software GridVis dispone di 3 Forme di rappresentazione:

I. Valutazione nella “Finestra riepilogativa“

I. fig.: “Risultato“ nella finestra riepilogativa

2. Valutazione nella “Finestra del grafico“

  • Aprire i “valori storici“ nella finestra della struttura dei valori.
  • Fare clic sul valore con il tasto destro.
  • Selezionare la voce “Mostra nel grafico“ nel menu contestuale.
  • Ulteriori funzioni di analisi sono disponibili nella barra degli strumenti del grafico.

2. Fig.: “Risultato“ nella finestra del grafico


3. Valutazione annuale dei costi e dei consumi energetici tramite la funzione “Esportazioni e report“ del software GridVis (Desktop):

  • Selezionare in “Esportazioni e report“ nella finestra dei progetti di GridVis con il tasto destro del mouse, la voce del menu contestuale “Crea nuovo report“.
  • Fare clic nella finestra “Selezionare un report“ sulla voce “Valutazione annuale dei costi e dei consumi energetici“.
  • Una procedura guidata guida l’utente nella configurazione del report.
  • Il software GridVis mette a disposizione diversi tipi di file (pdf, odt, html, xls) per l’output della valutazione annuale.

3. Fig.: “Risultato“ come report attraverso la funzione “Valutazione annuale dei costi e dei consumi energetici“