Versionen im Vergleich

Schlüssel

  • Diese Zeile wurde hinzugefügt.
  • Diese Zeile wurde entfernt.
  • Formatierung wurde geändert.
Kommentar: Mittels Scroll Versions veröffentlicht aus dem Bereich GVH und Version 1.0.
Sv translation
languagede

Anker
oben
oben


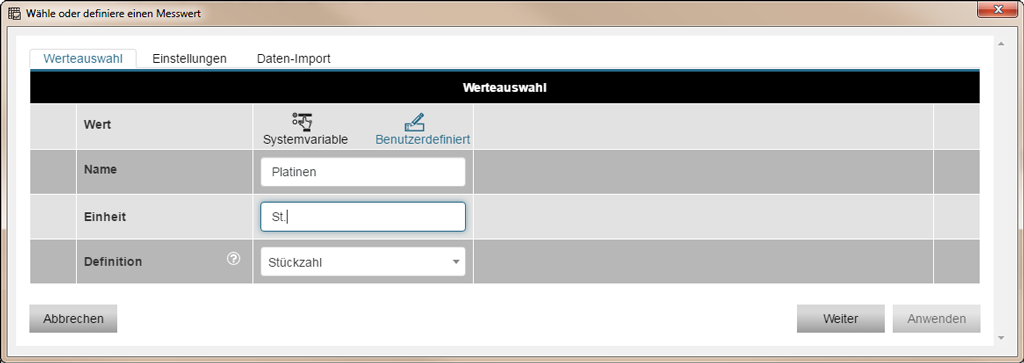
Beschreibung

Stückzahlen können wichtige Leistungskennzahlen (KPIs - Key Perfomance Indicator) für Ihr Energiemanagementsystem sein, die hinsichtlich wichtiger Zielsetzungen gemessen oder ermittelt werden. Leistungskennzahlen (KPIs) werden z.B. zur Untersuchung der Gesamtanlageneffektivität für die tatsächliche Auslastung einer Maschine gegenüber ihrer theoretischen Auslastung herangezogen.

Nachfolgend ist der CSV-Import von Platinen-Stückzahlen beispielhaft für den Daten-Import in die GridVis aufbereitet:

  • Konfigurieren Sie zunächst Ihr Gerät für den Daten-Import (DI) wie unter Daten-Import (DI) - Konfiguration beschrieben.
  • Folgen Sie danach der beispielhaften Konfiguration.

Abb.: Beispiel-Konfiguration eines CSV-Daten-Imports - 1. Register Werteauswahl


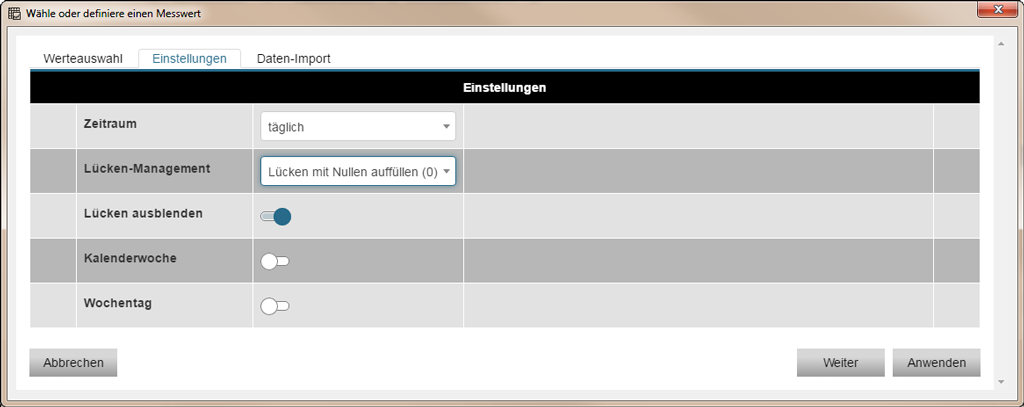
Abb.: Beispiel-Konfiguration eines CSV-Daten-Imports - 2. Register Einstellungen


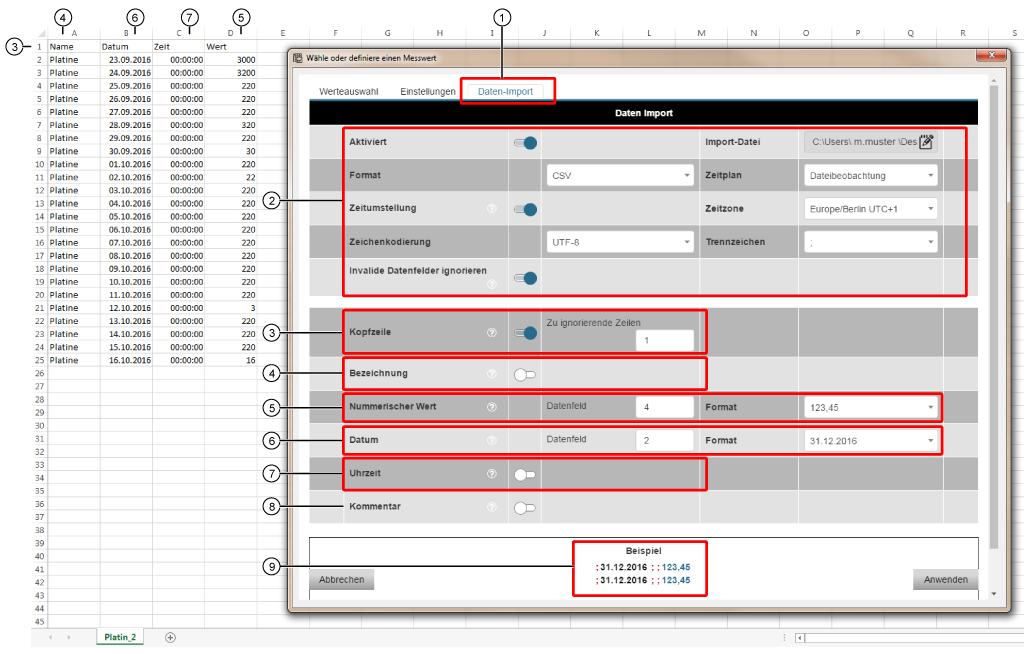
Abb.: Beispiel-Konfiguration eines CSV-Daten-Imports - 3. Register Einstellungen

Pos.Einstellungen der Parameter im Daten-ImportBeschreibung der CSV-Datei Formatierung
13. Register Daten-Import - zum aktivieren auf das Register klicken.

2

Konfigurieren Sie im Bereich Daten-Import die Parameter/Funktionen wie oben dargestellt.

3

Kopfzeile:

  • Schieberegler --> on
  • Eingabefeld Zu ingnorierende Zeilen --> 1
  • Da die Zu ignorierenden Zeilen den Wert 1 haben, werden die Kopfzeilen-Einträge Name, Datum, Zeit, Wert nicht eingelesen.
4Bezeichnung --> Schieberegler off
  • Die Bezeichnungen (Name = Platine) werden nicht eingelesen.
5

Nummerischer Wert:

  • Datenfeld 4
  • Format 123,45
  • Der Nummerische Wert steht in Spalte 4 (Datenfeld 4) der CSV-Datei.
6

Datum:

  • Datenfeld 2
  • Format 31.12.2016
  • Das Datum steht in Spalte 2 (Datenfeld 2) der CSV-Datei.
7Uhrzeit --> Schieberegler off
  • Die Uhrzeit wird nicht eingelesen.
8Kommentar --> Schieberegler off
  • Die CSV-Datei enthält keinen Kommentar. Der Kommentar wird nicht eingelesen.
9Formatierung --> Anzeige Beispiel
  • Die Spalten 2 und 4 werden eingelesen.
  • Alle Spalten sind durch Semikolons getrennt.

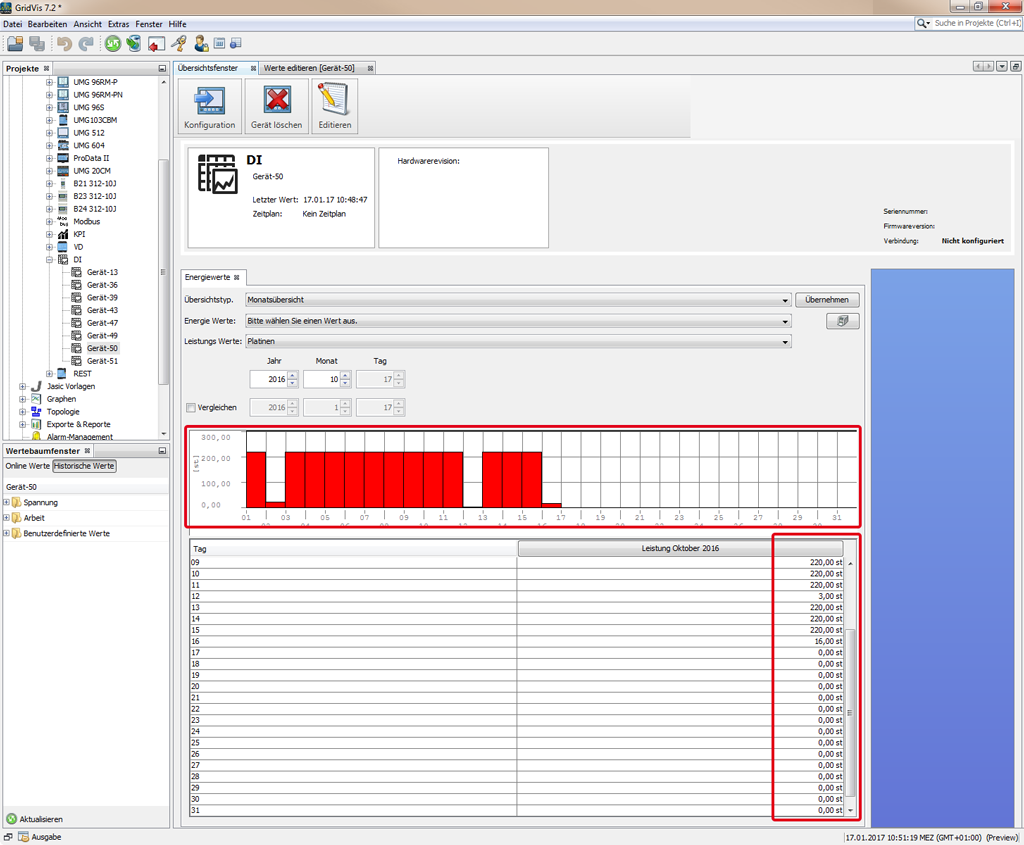
Klicken Sie zum Abschluß die Schaltfläche Anwenden, um Ihre Konfiguration einzulesen.


Für eine Auswertung Ihrer Daten verfügt die Software-GridVis über 3 Darstellungsformen:

I. Auswertung im Übersichtsfenster

I. Abb.: Ergebnis im Übersichtsfenster

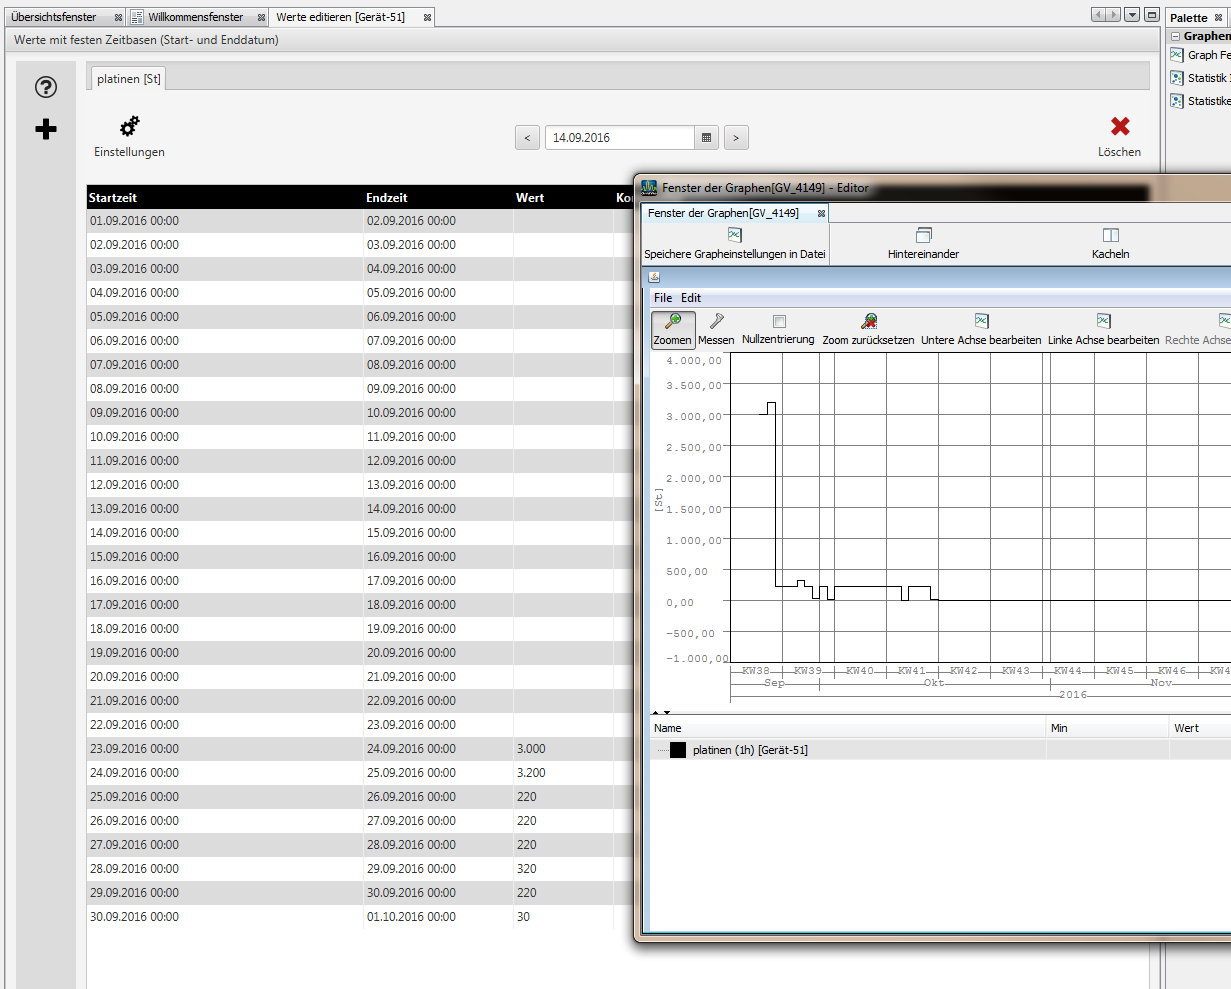
2. Auswertung im Fenster des Graphen:

  • Öffnen Sie im Wertebaumfenster Ihre historischen Werte.
  • Klicken Sie mit der rechten Maustaste auf Ihren Wert.
  • Wählen Sie im Kontextmenü den Eintrag Im Graphen anzeigen.
  • In der Symbolleiste des Graphen stehen Ihnen weitere Analyse-Funktionen zur Verfügung.


2. Abb.: Ergebnis im Fenster des Graphen


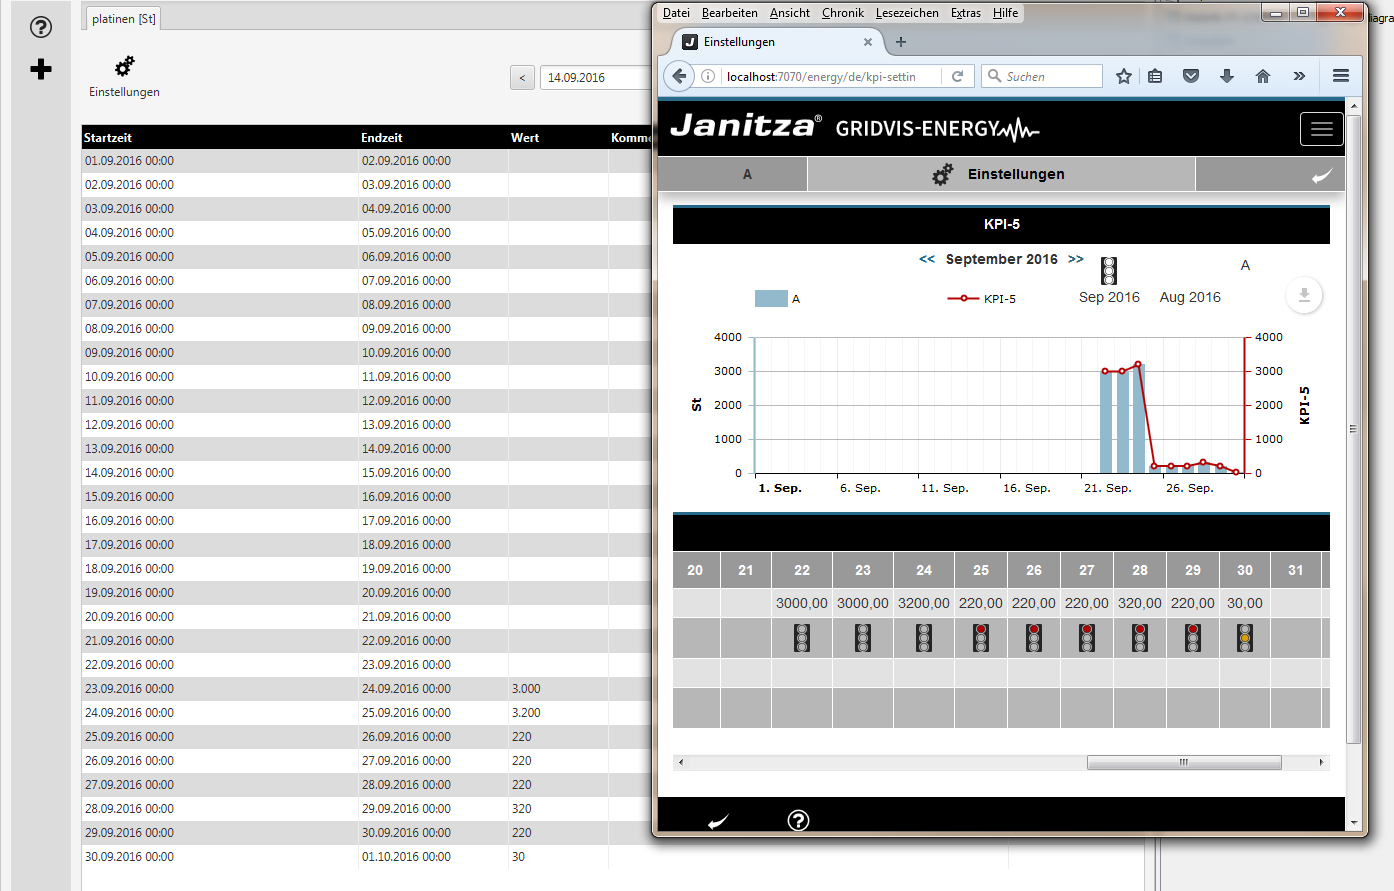
3. Auswertung über die Funktion KPI in der GridVis-Energy:

Loggen Sie sich in Ihre GridVis-Energy ein.

  • Wählen Sie in der Navigation den Menüeintrag Konfiguratoren.
  • Wählen Sie den Untermenüeintrag KPI.
  • Konfigurieren Sie die Darstellung Ihrer Auswertung, wie unter KPI-Manager beschrieben.
  • In der Darstellung als KPI stehen Ihnen weitere Funktionen der Analyse und Verarbeitung zur Verfügung (herunterladen, speichern, annotieren, drucken).


3. Abb.: Ergebnis als KPI-Darstellung in der GridVis-Energy (Webvisualisierung)


Sv translation
languageen

Anker
oben
oben


Description

Number of items can be an important key performance indicator (KPI) for your energy management system which is measured or determined for important goals. Key performance indicators (KPIs) are used e.g. for examining the total plant efficiency for the actual load of a machine versus its theoretical load.

In the following, the CSV import of platinum quantities serves as an example of preapring the data import to the GridVis:

Fig.: Example configuration of a CSV data import - First register "Value Selection"


Fig.: Example configuration of a CSV data import - Second register "Settings"


Fig.: Example configuration of a CSV data import - Third register "Settings"

Pos.Settings of the parameters in the "Data Import"Description of the "CSV File" formatting
FirstThird register "Data Import" -to activate, click on the register.
 
2

Configure the parameters/functions in the data import area as described above.

3

"Header":

  • Slider --> "on"
  • Entry field "Rows to be ignored" --> "1"
  • Because the "Rows to be ignored" have the value "1," the header entries "Name, Date, Time, Value" will not be read.
4"Designation" --> Slider "off"
  • The "Designations" (Name = Platinum) arenot read.
5

"Numerical Value":

  • Data field "4"
  • Format"123,45"
  • The"Numerical Value" is in the column "4"(Data field "4") of the CSV file.
6

"Date":

  • Data field "2"
  • Format"31.12.2016"
  • The"Date" is in the column "2" (Data field "2")of the CSV file.
7"Time" --> Slider "off"
  • The "Time" isnot read.
8"Comment" --> Slider "off"
  • The CSV file does not contain a "Comment". The "Comment" isnot read.
9"Formatting" --> Display"Example"
  • The columns "2" and "4" are read.
  • All columns are separated by semicolons.

Finally click on the button "Apply"to read in your configuration.


To analyze your data, the GridVis software has 3 forms of interpreting it:

1. Interpretation in the "Overview Window"

1. Fig.: "Result" in the overview window

2. Interpretation in the "Window of the Graph":

  • Open your "Historical Values" in the value tree window.
  • Right-click on your value.
  • Select the entry "Display in Graph" in the context menu.
  • More analysis functions are available to you in the symbol bar of the graph.


2. Fig.: "Result" in the graph window

3. Interpretation via the function "KPI" in GridVis Energy:

Log in in your GridVis Energy.

  • In the navigation, select the menu entry "Configurators."
  • Select the submenu entry "KPI."
  • Configure the depiction of your interpretation, as described in "KPI Manager ."
  • More functions are available for analyzing and processing (downloading, saving, annotating, printing) in the depiction as "KPI."


3. Fig.: "Result" as a KPI depicition in GridVis Energy (web visualization)


Sv translation
languagees

Anker
oben
oben


Descripción

Los números de unidades pueden ser importantes medidas de rendimiento (KPI: Key Performance Indicator) para su sistema de gestión energética, que pueden medirse y determinarse en relación con determinados objetivos de importancia; por ejemplo, las medidas de rendimiento (KPI) se emplean para examinar la eficacia de toda una instalación para la tasa de utilización real de una máquina en comparación con la tasa teórica.

A continuación se muestra un ejemplo de importación CSV de números de unidades de placas de circuitos; para ello, se ha preparado en GridVis una importación de datos:

Fig.: configuración de ejemplo para una importación de datos CSV; primera pestaña: «Selección de valores»


Fig.: configuración de ejemplo para una importación de datos CSV; segunda pestaña: «Ajustes»


Fig.: configuración de ejemplo para una importación de datos CSV; tercera pestaña: «Ajustes»

Pos.Ajustes de los parámetros en la «importación de datos»Descripción del formato del «archivo CSV»
1Tercera pestaña («Importación de datos»);haga clic en la pestaña para activarla.
 
2

En el panel de importación de datos, configure los parámetros o funciones como se muestra arriba.

3

«Encabezado»:

  • Control deslizante --> «on»
  • Campo de entrada «Filas a ignorar» --> «1»
  • Debido a que las «filas a ignorar» tienen el valor «1», no se cargan las entradas del encabezado «Nombre», «Fecha», «Hora» y «Valor».
4«Denominación» --> control deslizante «off»
  • Las «denominaciones» (nombre = placa)no se cargan.
5

«Valor numérico»:

  • Campo de datos «4»
  • Formato«123,45»
  • El«valor numérico» se encuentra en la columna «4»(campo de datos «4») del archivo CSV.
6

«Fecha»:

  • Campo de datos «2»
  • Formato«31.12.2016»
  • La«fecha» se encuentra en la columna «2» (campo de datos «2»)del archivo CSV.
7«Hora» --> control deslizante «off»
  • La «hora »no se carga.
8«Comentario» --> control deslizante «off»
  • El archivo CSV no contiene ningún «comentario». El «comentario »no se carga.
9«Formato» --> Visualización«Ejemplo»
  • Las columnas «2» y «4» se cargan.
  • Todas las columnas están separadas con punto y coma.

Para finalizar, haga clic en el botón «Aplicar»para cargar su configuración.


Para evaluar sus datos, el software GridVis dispone de tres formas de visualización:

1. Evaluación en la «ventana de vista general»

1. Fig.: «resultado» en la ventana de vista general

2. Evaluación en la «ventana de la gráfica»:

  • Abra sus «valores del historial» en la ventana del árbol de valores.
  • Haga clic con el botón derecho del ratón en su valor.
  • Elija el elemento «Mostrar en la gráfica» del menú contextual.
  • Usted dispone de más funciones de análisis en la barra de herramientas de la gráfica.


2. Fig.: «resultado» en la ventana de la gráfica

3. Evaluación mediante la función «KPI» en GridVis Energy:

Inicie sesión en su GridVis Energy.

  • En la navegación, elija el elemento de menú «Configuradores».
  • Elija el elemento de submenú «KPI».
  • Configure la representación de su evaluación como se describe en «Administrador de KPI» .
  • En la representación como «KPI», usted dispone de más funciones de análisis y procesamiento (descargar, guardar, anotar e imprimir).


3. Fig.: «resultado» como representación KPI en GridVis Energy (visualización web)


Sv translation
languageit

Anker
oben
oben


Descrizione

I numeri delle unità possono essere importanti indicatori chiave di prestazione (KPI) per il sistema di gestione dell’energia, misurati o identificati rispetto a obiettivi importanti. Gli indicatori chiave di prestazione (KPI) vengono utilizzati, ad esempio, per esaminare l’efficacia complessiva delle apparecchiature per l’utilizzo effettivo di una macchina rispetto al suo utilizzo teorico.

Di seguito è riportato un esempio di importazione di CSV delle quantità di PCB per inserire i dati in GridVis:

Fig.: Esempio di configurazione di un’importazione di dati CSV - 1. Scheda “Seleziona valori“


Fig.: Esempio di configurazione di un’importazione di dati CSV - 2. Scheda “Impostazioni“


Fig.: Esempio di configurazione di un’importazione di dati CSV - 3. Scheda “Impostazioni“

Pos.Impostazioni dei parametri in “Importazione dati”Descrizione della formattazione del “file CSV“
13. Scheda “Importazione dati“ - Fare clic sulla scheda da attivare.

2

Nella sezione Importazione dati, configurare i parametri/funzioni come indicato sopra.

3

“Intestazione“:

  • Cursore --> “on“
  • Campo “Righe da ignorare” --> “1”
  • Dal momento che le “Righe da ignorare“ presentano il valore “1“, le voci di intestazione “Nome, Data, Ora, Valore“ non vengono mappate.
4“Denominazione“ --> Cursore “off“
  • Le “Denominazioni“ (Nome = PCB) non vengono mappate.
5

“Valore numerico“:

  • Campo dati “4“
  • Formato “123,45“
  • Il “Valore numerico“ si trova nella colonna “4“ (Campo dati “4“) del file CSV.
6

“Data“:

  • Campo dati “2“
  • Formato “31.12.2016“
  • La “Data“ si trova nella colonna “2“ (Campo dati “2“) del file CSV.
7“Ora“ --> Cursore “off“
  • L’“Ora“ non viene mappata.
8“Commento“ --> Cursore “off“
  • Il file CSV non contiene nessun “Commento“. Il “Commento“ non viene mappato.
9“Formattazione“ --> Schermata “Esempio“
  • Le colonne “2“ e “4“ vengono mappate.
  • Tutte le colonne sono separate da un punto e virgola.

Per terminare, fare clic sul pulsante “Applica“, per mappare la configurazione.


Per una valutazione dei dati, il software GridVis dispone di 3 Forme di rappresentazione:

I. Valutazione nella “Finestra riepilogativa“

I. fig.: “Risultato“ nella finestra riepilogativa

2. Valutazione nella “Finestra del grafico“:

  • Aprire i “valori storici“ nella finestra della struttura dei valori.
  • Fare clic sul valore con il tasto destro.
  • Selezionare la voce “Mostra nel grafico“ nel menu contestuale.
  • Ulteriori funzioni di analisi sono disponibili nella barra degli strumenti del grafico.


2. Fig.: “Risultato“ nella finestra del grafic


3. Valutazione tramite la funzione “KPI“ di GridVis-Energy:

Accedere a GridVis-Energy.

  • Nella navigazione, selezionare la voce di menu “Configuratori“.
  • Selezionare la voce di sottomenu “KPI“.
  • Configurare la rappresentazione della valutazione come descritto in Manager KPI.
  • Nella presentazione come “KPI“ sono disponibili ulteriori funzioni di analisi ed elaborazione (download, salvataggio, annotazione, stampa).


3. Fig.: “Risultato“ come rappresentazione KPI in GridVis-Energy (visualizzazione web)