Versionen im Vergleich

Schlüssel

  • Diese Zeile wurde hinzugefügt.
  • Diese Zeile wurde entfernt.
  • Formatierung wurde geändert.
Kommentar: Mittels Scroll Versions veröffentlicht aus dem Bereich GVH und Version 1.0.
Sv translation
languagede

Gültig für

GridVis-EditionenSoftware-Plattform

Image Modified

Image Modified


PositionBeschreibung
1Über den Eintrag Graphen im Projektefenster öffnen Sie das Fenster der Graphen. Hier können Messwerte grafisch angezeigt werden.
2

Im Fenster Palette wählen Sie die Darstellungsform der Messwerte aus.

Info
titleHinweis

Falls das Fenster nicht sichtbar ist, öffnen Sie es über den Reiter Fenster → Werkzeuge → Palette.


Graphen öffnen

  1. Öffnen Sie den Projektbaum und klicken Sie auf den Eintrag Graphen. Das Fenster der Graphen öffnet sich.

  2. Ziehen Sie einen der Graphen aus dem Fenster Palette per Drag-and-Drop in das Fenster der Graphen. 


Image Modified

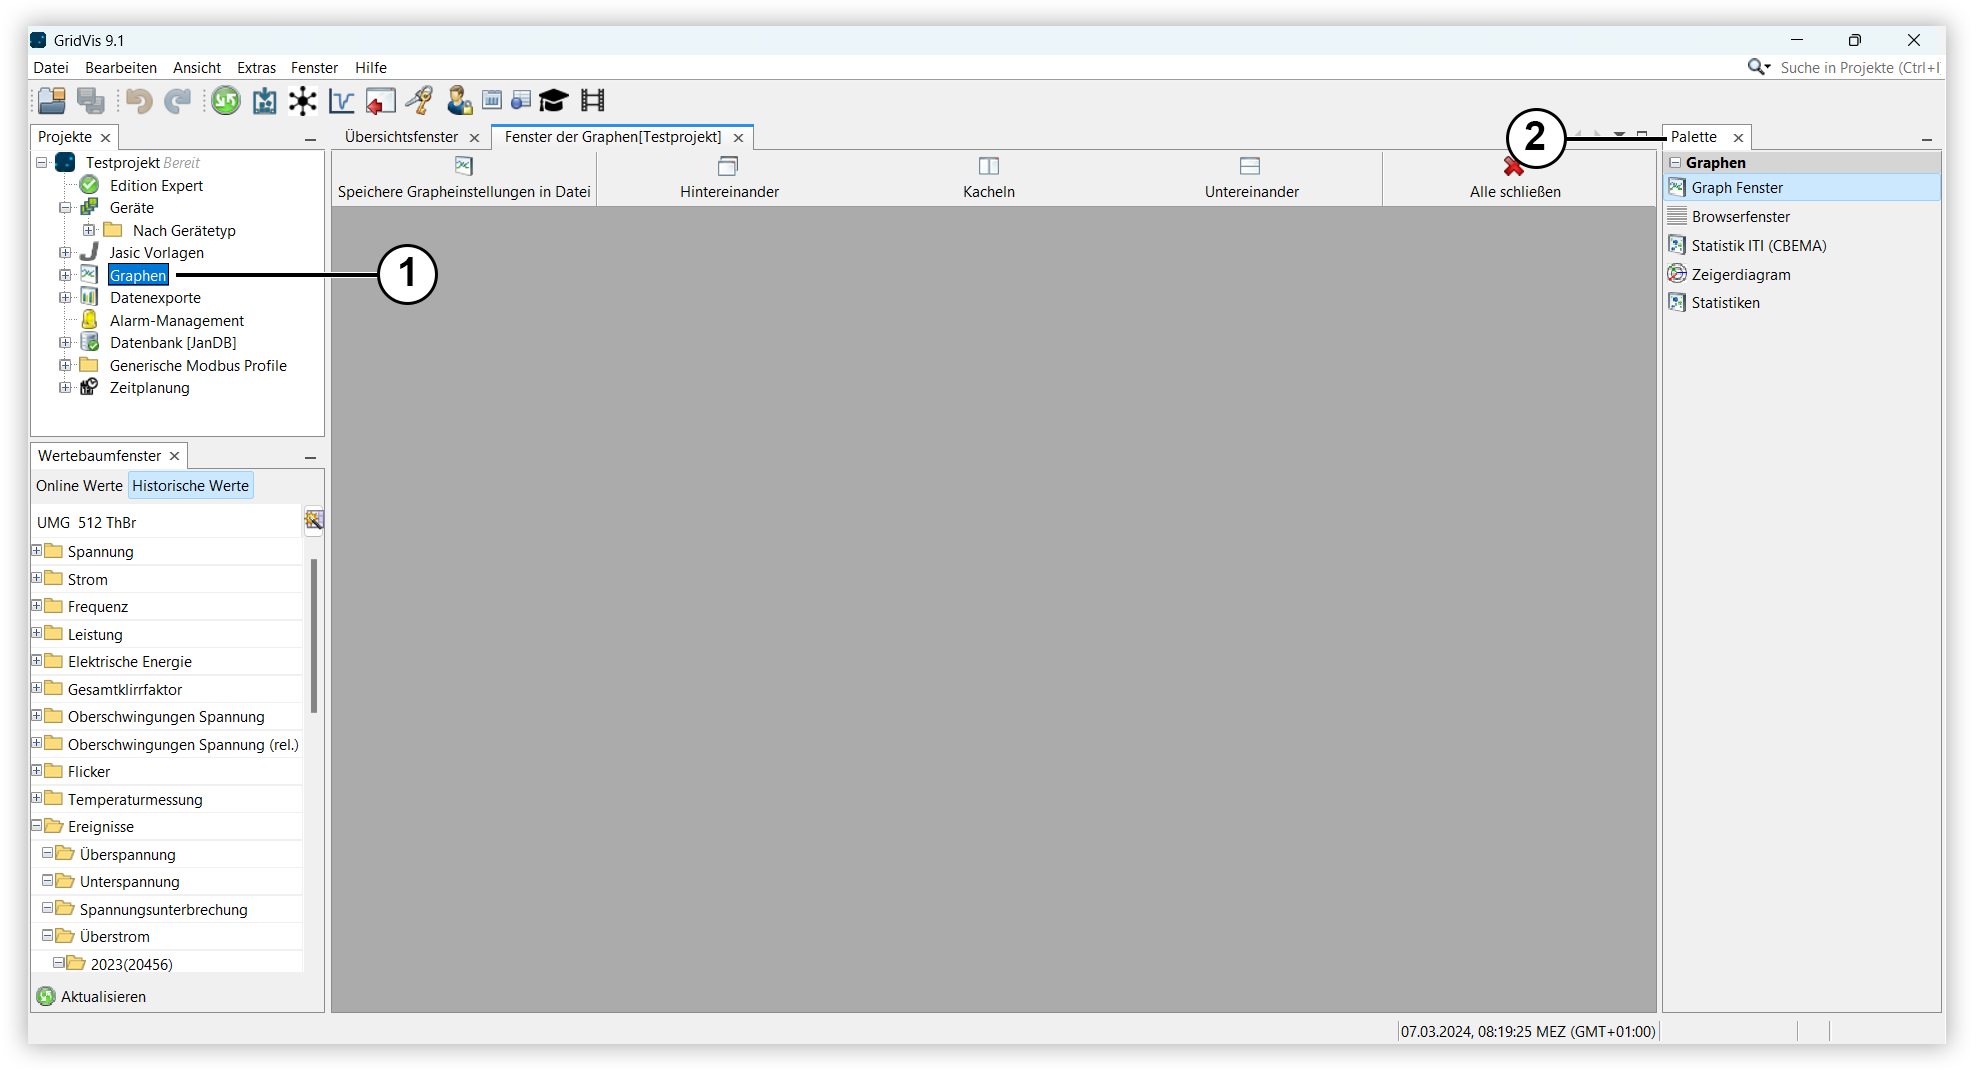
Übersicht: Fenster des Graphen

Messwert(e) in Graph anzeigen

Ziehen Sie je nach Graph Messwerte, Messwertegruppen oder Geräte per Drag-and-Drop in den Graph um diese zu visualisieren:

  • Graph Fenster: Ziehen Sie Messwerte oder Messwertegruppen aus dem Wertebaumfenster in den Graph, um diese als Liniendiagramm darzustellen. In der Legende können Sie per Rechtsklick auf einen Messwert das Kontextmenü öffnen und die Grapheigenschaften anpassen.
  • Browserfenster: Ziehen Sie Ereignisse, Transienten oder Sequenzen in den Graph. Das Browserfenster stellt die Messwerte tabellarisch dar. Mit Rechtsklick oder über die Schaltfläche Im Graphen anzeigen können Sie die Werte auch grafisch darstellen lassen.
  • Statistik ITI (CBEMA): Eine Erklärung zur CBEMA-Kurve finden Sie hier: CBEMA-Kurve
  • Zeigerdiagramm: Ziehen Sie ein Gerät per Drag-and-Drop auf das Zeigerdiagramm oder wählen Sie Zeige Zeigerdiagramm über einen Rechtsklick auf das Gerät im Projektefenster. Das Zeigerdiagramm zeigt die Phasenwinkel und Drehfeldrichtung des gewählten Geräts.
  • Statistiken: Ziehen Sie historische Messwerte oder Messwertegruppen aus dem Wertebaumfenster in den Graph. Die Werte können über die Statistikeigenschaften im Fenster variiert werden.


Grapheneinstellungen in Datei speichern

  1. Öffnen Sie einen Graphen.
  2. Ziehen Sie die gewünschten Messwerte oder ein Gerät in den Graph. 
  3. Klicken Sie im Fenster des Graphen auf die Schaltfläche Speichere Grapheinstellungen in Datei.
  4. Vergeben Sie einen Namen im Feld Dateiname
  5. Wählen Sie aus, ob und für welchen Zeitraum die Werte neu geladen werden sollen.
    • Online Werte: Die Auswahl hat keine Funktion.
    • Historische Werte: Die Messwerte werden für den ausgewählten Zeitraum dargestellt. Mit der Einstellung Werte nicht neu laden, wenn geöffnet werden die aktuell im Graph angezeigten Messwerte in der Datei gespeichert.
  6. Bestätigen Sie die Auswahl mit OK
  7. Die gespeicherte Grapheinstellung wird im Eintrag Graphen im Projektefenster als Datei gespeichert.


Sv translation
languageen

Valid for
GridVis EditionsSoftware platform

Image Added

Image Added


PositionDescription
1

Use the Graph item in the project window to open the GraphDesktop window. Measured values can be displayed graphically here.

2

Use the Palette window to select the display format for the measured values.

Info
titleNote

If the window is not visible, open it via the tab Window → IDE Tools → Palette.


Opening graphs

  1. Open the project tree and click the item Graph. The GraphDesktop window opens.
  2. Use drag and drop to drag one of the graphs from the Palette windowinto the GraphDesktop window.  


Image Added

Overview: GraphDesktop window

Displaying measured value(s) in a graph

Depending on the graph, drag and drop measured values, groups of measured values or devices into the graph to visualize them:

  • Graph Window: Drag measured values or groups of measured values from the ValueExplorer window into the graph to display them as a line diagram. In the legend, you can right-click on a measured value to open the context menu and adjust the graph properties.
  • Browser window: Drag events, transients or sequences into the graph. The browser window displays the measured values in tabular form. Right-clicking or using the Show in graph button allows you to display the values graphically as well.
  • Statistic ITI (CBEMA): An explanation of the CBEMA curve can be found here: CBEMA-Kurve
  • Phasor graph: Drag and drop a device into the phasor diagram or select Show phasor graph by right-clicking on the device in the project window. The phasor graph shows the phase angle and direction of the rotary field for the selected device.
  • Statistics: Drag historical measured values or groups of measured values from the ValueExplorer window into the graph. The values can be varied using the statistics properties in the window.


Save graph settings to file

  1. Open a graph.
  2. Drag the desired measured values or a device into the graph. 
  3. In the GraphDesktop window, click on the Save graph settings to file button.
  4. Enter a name in the Filename field.
  5. Select whether and for what period the values should be reloaded.
    • Online values: This selection has no function.
    • Historical values: The measured values are displayed for the selected period. With the setting Do not reload values when opened, the measured values currently displayed in the graph are saved in the file.
  6. Confirm the selection with OK
  7. The saved graph setting is displayed in the Graph item in the project window as a file.


Sv translation
languageit

Valido per

Edizioni GridVisPiattaforma software

Image Added

Image Added


PosizioneDescrizione
1

Tramite la voce Grafico nella finestra del progetto si apre la Finestra Desktop Grafico. Qui è possibile visualizzare graficamente i valori delle letture.

2

Nella finestra Paletta è possibile selezionare il formato di visualizzazione delle letture.

Info
titleNota

Se la finestra non è visibile, aprirla tramite la scheda Finestra → Utensili → Paletta.

Aprire i grafici

  1. Aprite la struttura del progetto e fate clic sulla voce Grafico. Si apre la Finestra Desktop Grafico.
  2. Trascinare uno dei grafici fuori dalla finestra Paletta tramite Drag-and-Drop nella Finestra Desktop Grafico.

Image Added

Panoramica:Finestra Desktop Grafico


Visualizzazione delle letture in un grafico

A seconda del grafico, è possibile trascinare letture, gruppi di letture o dispositivi nel grafico per visualizzarli:

  • Finestra grafico: Trascinare le letture o i gruppi di letture dalla finestra dell'albero dei valori nel grafico per visualizzarli come grafico a linee. Nella legenda, è possibile fare clic con il tasto destro su una lettura per aprire il menu contestuale e modificare le proprietà del grafico.
  • Finestra browser: Trascinare eventi, transitori o sequenze nel grafico. La finestra del browser mostra le letture in forma tabellare. Facendo clic con il tasto destro o con il pulsante Mostra nel grafico è possibile visualizzare i valori anche in forma grafica.
  • Statistica ITI (CBEMA): Una spiegazione della curva CBEMA è disponibile qui: CBEMA-Kurve
  • Grafico fasore: Trascinare e rilasciare un dispositivo sul diagramma vettoriale o selezionare Mostra grafico fasore facendo clic con il tasto destro sul dispositivo nella finestra del progetto. Il diagramma vettoriale mostra l'angolo di fase e la direzione del campo rotante del dispositivo selezionato.
  • Statistica: Trascinare le letture storiche o i gruppi di letture dalla finestra dell'albero dei valori nel grafico. I valori possono essere modificati utilizzando le proprietà delle statistiche nella finestra.


Salva le impostazioni del grafico nel file

  1. Aprire un grafico.
  2. Trascinare le letture desiderate o un dispositivo nel grafico. 
  3. Fare clic nella Finestra Desktop Grafico sul pulsante Salva le impostazioni grafico nel file.
  4. Assegnare un nome nel campo Nome file
  5. Selezionare se e per quanto tempo i valori devono essere ricaricati. 
    • Valori online: La selezione non ha alcuna funzione.
    • Valori storici: Vengono visualizzate le letture per il periodo selezionato. Con le impostazioni Non ricaricare i valori quando è aperto le letture attualmente visualizzate nel grafico vengono salvate nel file.
  6. Confermare la selezione con OK
  7. L'impostazione del grafico salvato viene salvata come file nella voce Grafico della finestra del progetto.


Sv translation
languagees

Válido para

Ediciones de GridVisPlataforma de software

Image Added

Image Added


PosiciónDescripción
1

A través de la entrada Gráficas en la ventana de proyectos podrá abrir la Ventana de las gráficas. Aquí pueden visualizarse gráficamente los valores de medición.

2

En la ventana Paleta podrá seleccionar la forma de representación de los valores de medición.

Info
titleNota

Si la ventana no está visible, podrá abrirla a través de la pestaña Ventana → Herramientas IDE → Paleta.

Abrir gráficos

  1. Abra el árbol de proyectos y haga clic en la entrada Gráficas. Se abre la Ventana de las gráficas.
  2. Arrastre uno de las gráficas de la ventana Paleta mediante la función de arrastrar y soltar a la Ventana de las gráficas.


Image Added

Resumen: Ventana de las gráficas

Mostrar valor(es) de medición en un gráfico

Dependiendo del gráfico, arrastre al gráfico valores de medición, grupos de valores de medición o dispositivos mediante la función de arrastrar y soltar para visualizarlos:

  • Ventana de gráfica: arrastre valores de medición o grupos de valores de medición de la ventana del árbol de valores al gráfico para visualizarlos como gráfico lineal. Haciendo clic con el botón derecho del ratón en un valor de medición, en la leyenda podrá abrir el menú contextual y adaptar las propiedades del gráfico.
  • Ventana del explorador: arrastre eventos, transitorios o secuencias al gráfico. La ventana del navegador representa los valores de medición como tabla. Haciendo clic con el botón derecho del ratón o a través del botón Mostrar en la gráfica también podrá representar gráficamente los valores.
  • Estadística ITI (CBEMA): aquí encontrará una explicación acerca de la curva CBEMA: CBEMA-Kurve
  • Diagrama fasorial: Arrastre un dispositivo mediante la función de arrastrar y soltar al diagrama fasorial o seleccione Mostrar diagrama fasorial haciendo clic con el botón derecho del ratón en el dispositivo en la ventana de proyectos. El diagrama fasorial muestra los ángulos de fase y el sentido del campo giratorio del dispositivo seleccionado.
  • Estadísticas: arrastre valores de medición o grupos de valores de medición históricos de la ventana del árbol de valores al gráfico. Los valores pueden variarse a través de las propiedades de la estadística en la ventana.


Guardar los ajustes de un gráfico en un archivo

  1. Abra un gráfico.
  2. Arrastre los valores de medición deseados o un dispositivo al gráfico.
  3. En la Ventana de las gráficas, haga clic en el botón Guardar los ajustes de gráfica en el archivo.
  4. Asigne un nombre en el campo Nombre del archivo
  5. Seleccione si los valores deben volver a cargarse y para qué periodo de tiempo.
    • Valores en línea: la selección no tiene función.
    • Valores del historial: los valores de medición se representan para el periodo de tiempo seleccionado. Con el ajuste No volver a cargar los valores si están abiertos, los valores de medición actualmente mostrados en el gráfico se guardan en el archivo.
  1. Confirme la selección con Aceptar
  2. El ajuste guardado del gráfico se almacena como archivo en la entrada Gráficas en la ventana de proyectos.