Versionen im Vergleich

Schlüssel

  • Diese Zeile wurde hinzugefügt.
  • Diese Zeile wurde entfernt.
  • Formatierung wurde geändert.
Kommentar: Mittels Scroll Versions veröffentlicht aus dem Bereich GVH und Version 1.0.
Sv translation
languagede


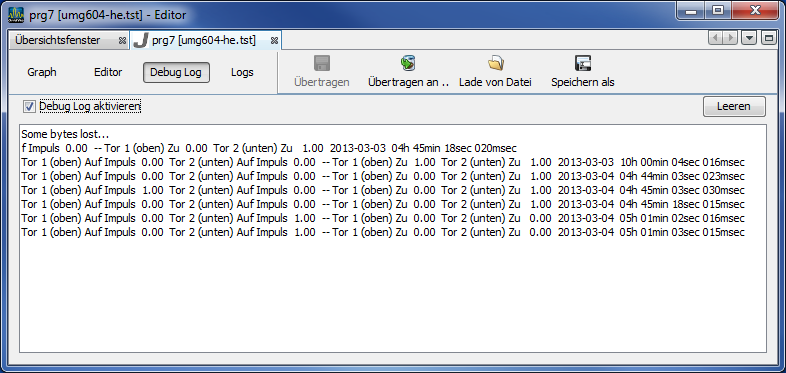
Ein auf ein Gerät übertragenes JASIC-Programm kann im Debug-Modus über bspw. die Log-Funktion Debug-Informationen aufzeichnen und ausgeben.


Beispiel:

  1. Erstellen Sie in der graphischen JASIC-Umgebung ein Programm mit Log-Funktion.
  2. Übertragen Sie das Programm über die Schaltfläche Übertragen an.. in der JASIC-Umgebung.
  3. Wählen Sie ein aktives Gerät und einen freien Programmplatz aus und beenden Sie die Aktion mit Beenden.
  4. Öffnen Sie das Übersichtsfenster und wählen Sie im Projektefenster das Gerät an.
  5. Durch das Auswählen des soeben übertragenen Programms im Bereich Jasic Informationen wird dieses in die GridVis® geladen und in einem weiteren Programmfenster dargestellt.


  1. Selektieren Sie im Programmfenster die Schaltfläche Debug Log und starten Sie die Protokollierung der Debug-Informationen durch Aktivieren des Schalters Debug Log aktivieren.

Debug-Schaltflächen

    • Leeren: Der Inhalt des Debug-Fensters wird gelöscht.
    • Debug Log aktivieren: Über diesen Schalter werden die Debug-Informationen ausgegeben oder unterdrückt.

Sv translation
languageen


In debug mode, a JASIC program which has been transferred to a device can record and output debugging information, using the log function for example.


Example:

  1. Create a program in the graphic JASIC environment using the Log-Funktion.
  2. Transmit the program to the JASIC environment using the Transmit  to... button.
  3. Select an active device and an available location in the program and end the action with Finish.
  4. Open the Overview window and select the device in the  Projects window.
  5. By selecting the program just transmitted in the Jasic information area, it is loaded into the GridVis® and displayed in another program window.


  1. Select the Debug log button in the program window and start the debugging information by clicking the Enable debug log button.

Debug buttons

    • Empty: This deletes the contents of the Debug window.
    • Enable debug log: The debugging information is displayed or disabled via this button.

Sv translation
languagees


Un programa JASIC transferido a un dispositivo puede registrar y emitir informaciones de depuración en el modo de depuración, por ejemplo, a través de la función Log (Registro).


Ejemplo:

  1. Cree en el entorno JASIC gráfico un programa con Log-Funktion.
  2. Transfiera el programa a través del botón Transmit to... (Transmitir a) en el entorno JASIC.
  3. Seleccione un dispositivo activo y una ubicación libre del programa y finalice la acción con Finish (Finalizar).
  4. Abra la ventana de resumen y seleccione el dispositivo en la ventana de proyectos.
  5. Mediante la selección del programa recién transferido en la sección Jasic Information (Información Jasic), este se carga en GridVis® y se representa en otra ventana del programa.


  1. En la ventana del programa, seleccione el botón Debug Log (Registro depuración) y active el registro de las informaciones de depuración activando la casilla Enable debug log (Habilitar registro depuración).

Botones de depuración

    • Empty (Vaciar): se borra el contenido de la ventana de depuración.
    • Enable debug log (Habilitar registro depuración): a través de esta casilla se emiten o se suprimen las informaciones de depuración.

Sv translation
languageit


Un programma JASIC trasferito ad un dispositivo può registrare ed emettere informazioni di debug in modalità debug, ad esempio tramite la funzione log.


Esempio:

  1. Nell’ambiente grafico JASIC, creare un programma con Log-Funktion.
  2. Trasferire il programma tramite il pulsante Trasferisci a.. nell’ambiente JASIC.
  3. Selezionare un dispositivo attivo e una posizione di programma libera e terminare l’azione con Termina.
  4. Aprire la finestra riepilogativa e selezionare il dispositivo nella finestra del progetto.
  5. Selezionando il programma appena trasferito nell’area Informazioni Jasic, quest’ultimo viene caricato in GridVis® e visualizzato in un’altra finestra del programma.


  1. Selezionare il pulsante Registro di debug nella finestra del programma e avviare la registrazione delle informazioni di debug attivando il pulsante Abilitare il registro di debug.

Pulsanti debug

    • Svuotare: Il contenuto della finestra di debug viene cancellato.
    • Abilitare il registro di debug: Questo interruttore serve per emettere o sopprimere le informazioni di debug.