
| Sv translation | ||||||||||||||||||||||||||||||||||||||||||||||||||||||||||||||||||||||||||||||||||||||||||||||||||||||||||||||||||||||||||||||||||||||||||||||||||||||||||||||||||||||||||||||||||||||||||||||||||||||||||||||||||||||||||||||||||||||||||||||||||||||||||||||||||||||||||||||||||||||||||||||||||||||||||||||||||||||||||||||||||||||||||||||||||||||||||||||||||||||||||||||||||||||||||||||||||||||||||||||||||||
|---|---|---|---|---|---|---|---|---|---|---|---|---|---|---|---|---|---|---|---|---|---|---|---|---|---|---|---|---|---|---|---|---|---|---|---|---|---|---|---|---|---|---|---|---|---|---|---|---|---|---|---|---|---|---|---|---|---|---|---|---|---|---|---|---|---|---|---|---|---|---|---|---|---|---|---|---|---|---|---|---|---|---|---|---|---|---|---|---|---|---|---|---|---|---|---|---|---|---|---|---|---|---|---|---|---|---|---|---|---|---|---|---|---|---|---|---|---|---|---|---|---|---|---|---|---|---|---|---|---|---|---|---|---|---|---|---|---|---|---|---|---|---|---|---|---|---|---|---|---|---|---|---|---|---|---|---|---|---|---|---|---|---|---|---|---|---|---|---|---|---|---|---|---|---|---|---|---|---|---|---|---|---|---|---|---|---|---|---|---|---|---|---|---|---|---|---|---|---|---|---|---|---|---|---|---|---|---|---|---|---|---|---|---|---|---|---|---|---|---|---|---|---|---|---|---|---|---|---|---|---|---|---|---|---|---|---|---|---|---|---|---|---|---|---|---|---|---|---|---|---|---|---|---|---|---|---|---|---|---|---|---|---|---|---|---|---|---|---|---|---|---|---|---|---|---|---|---|---|---|---|---|---|---|---|---|---|---|---|---|---|---|---|---|---|---|---|---|---|---|---|---|---|---|---|---|---|---|---|---|---|---|---|---|---|---|---|---|---|---|---|---|---|---|---|---|---|---|---|---|---|---|---|---|---|---|---|---|---|---|---|---|---|---|---|---|---|---|---|---|---|---|---|---|---|---|---|---|---|---|---|---|---|---|---|---|---|---|---|---|---|---|---|---|---|---|---|---|---|---|---|---|---|---|---|---|---|---|---|---|---|---|---|---|---|---|---|---|---|---|---|---|---|---|---|
| ||||||||||||||||||||||||||||||||||||||||||||||||||||||||||||||||||||||||||||||||||||||||||||||||||||||||||||||||||||||||||||||||||||||||||||||||||||||||||||||||||||||||||||||||||||||||||||||||||||||||||||||||||||||||||||||||||||||||||||||||||||||||||||||||||||||||||||||||||||||||||||||||||||||||||||||||||||||||||||||||||||||||||||||||||||||||||||||||||||||||||||||||||||||||||||||||||||||||||||||||||||
|


| Anker | ||||
|---|---|---|---|---|
|
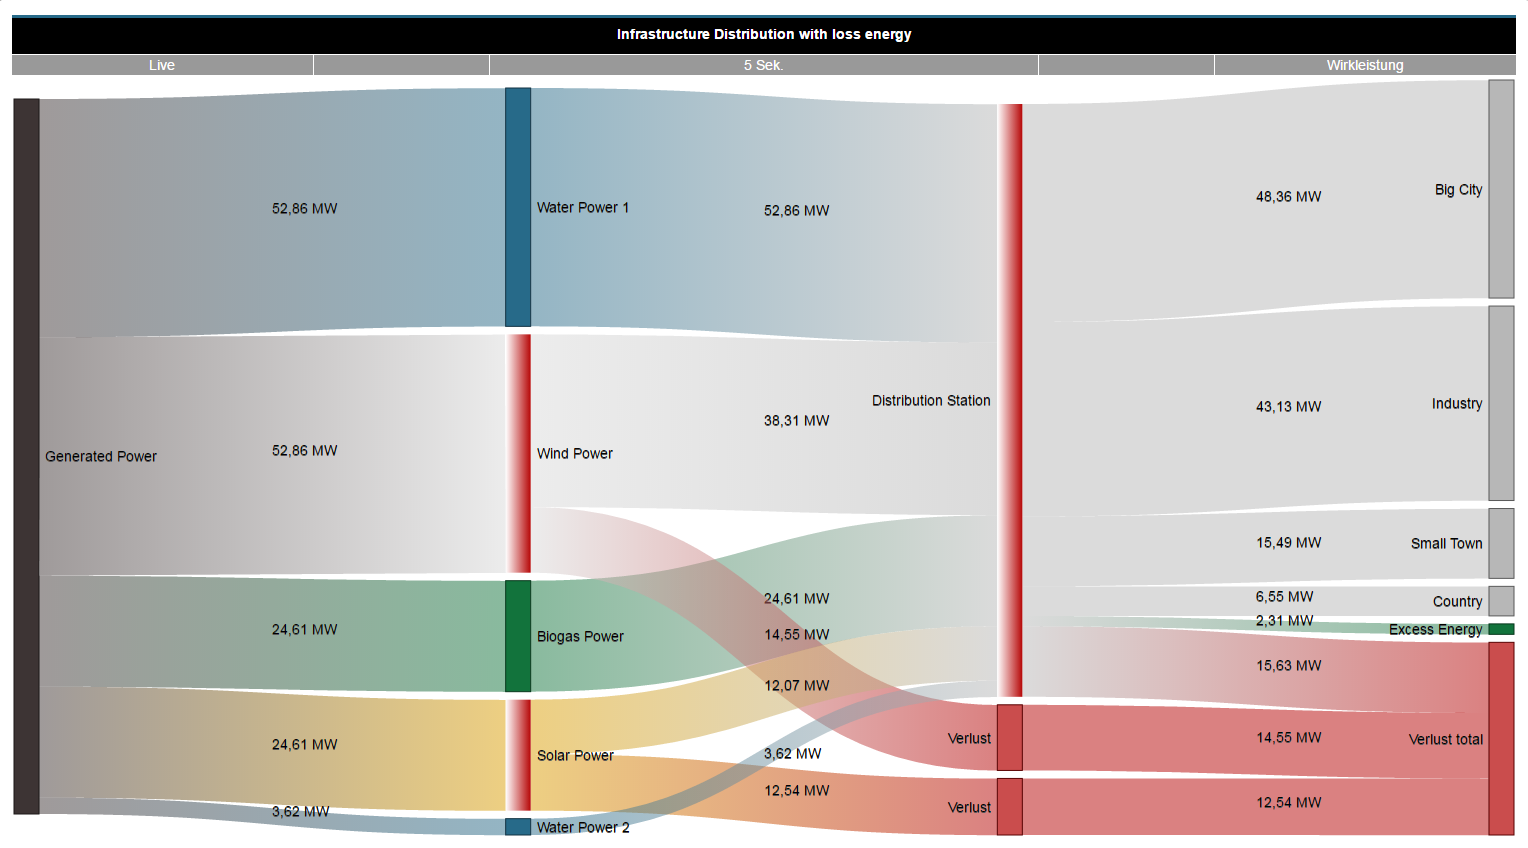
Das Sankey-Diagramm
- Veranschaulicht Energieflüsse (Mengenflüsse) grafisch in Form von Diagrammen.
- Verbindungsflächen zeigen Verbrauchsdaten oder andere Messwerte proportional zur Messwertgröße.
- Lässt sich einfach und intuitiv mit dem Sankey-Konfigurator erstellen und mit dem Sankey-Manager verwalten.
- Kann in jedes Dashboard als Widget integriert und ausgewertet werden.
Die Sankey-Funktion besteht aus 3 Bereichen:
| 1. | Sankey-Manager | Verwaltungstool für Sankey-Diagramme. |
| 2. | Sankey-Konfigurator | Erstellung individueller Sankey-Diagramme. |
3. | Sankey-Widget | Kann auf dem Dashboard platziert werden. |
Der Sankey-ManagerAnker sankeymanager sankeymanager
Der Sankey-Manager ist das Verwaltungs-Tool für Sankey-Diagramme.
Der Sankey-Manager
- Verwaltet alle Sankey-Diagramme.
- Bietet eine strukturierte und informative Übersicht aller bestehenden Sankey-Diagramme.
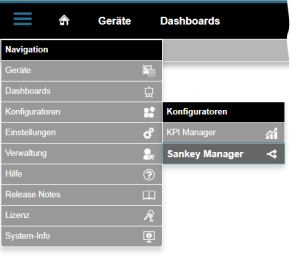
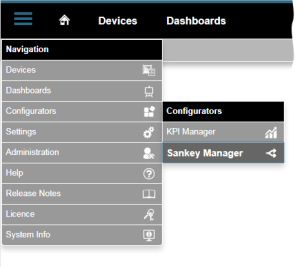
Wie öffne ich den Sankey-Manager?
- Klicken Sie in der Navigationsleiste auf die Schaltfläche Navigation
 .
. - Den Sankey-Manager
 erreichen Sie Im Ausklapp-Menü unter Konfiguratoren
  .
.
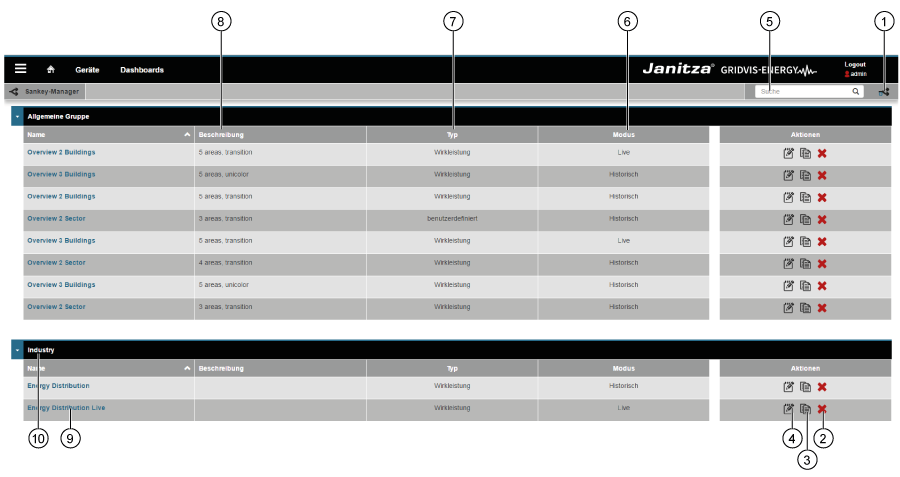
Bereich Sankey-Manager (Übersichtsfenster):
| Pos. | Icon | Kurztext | Beschreibung |
|---|---|---|---|
| 1 | erstellen | Neues Sankey-Diagramm erstellen. | |
| 2 | löschen | Sankey-Diagramm löschen. | |
| 3 | kopieren | Sankey-Diagramm kopieren. | |
| 4 | öffnen | Sankey-Konfigurator öffnen. | |
| 5 | suchen und filtern | Sankey-Diagramm suchen und filtern. | |
| 6 | Modus | Modus des Sankey-Diagramms. Das Sankey-Diagramm zeigt Live-Werte oder Historische-Werte. | |
| 7 | Typ | Typ des Messwerts (z.B. Wirkleistung). | |
| 8 | Beschreibung | Informationstext der zu einem Sankey-Diagramm hinterlegt wurde. | |
| 9 | Name | Name des Sankey-Diagramms. Mit Klick auf den Namen, öffnet sich eine Vorschau. | |
| 10 | Gruppe | Sankey-Diagramm Gruppe. Im Sankey-Konfigurator konfigurierbar. |
Der Sankey-KonfiguratorAnker sankeykonfigurator sankeykonfigurator
Über den Sankey-Konfigurator erstellen Sie eigene Sankey-Diagramme ohne Programmierkenntnisse. Um ein Sankey-Diagramm zu zeichnen, erstellen Sie im Sankey-Konfigurator Knoten und Verbindungen und verknüpfen diese, je nach Bedarf, miteinander (vgl. auch mit Beschreibung Knoten und Verbindungen).
Der Sankey-Konfigurator
- Besteht aus 4 Bereichen (Einstellungen, Knoten, Verbindungen und Vorschau).
- Dient der Erstellung individueller Sankey-Diagramme ohne Programmierkenntnisse, durch Erstellung und Verknüpfung von Knoten und Verbindungen.
- Dient z.B. der Erstellung von Energieflussanalysen Ihrer Firma ohne großen Aufwand. Sie können auch Messwerte, wie Strom, Wirkleistung oder Oberschwingungen auswählen und darstellen. Voraussetzung für Energieflussanalysen sind Messgeräte, z.B. von der Firma Janitza. Diese müssen an den gewünschten Messpunkten eingesetzt werden und mittels dem Sankey-Konfigurator verknüpft werden.
- Öffnet sich für jedes Sankey-Diagramm durch Klicken des Buttons
 im Bereich Aktionen im Sankey-Manager
(siehe Screen Der Sankey-Manager unter Pos.4).
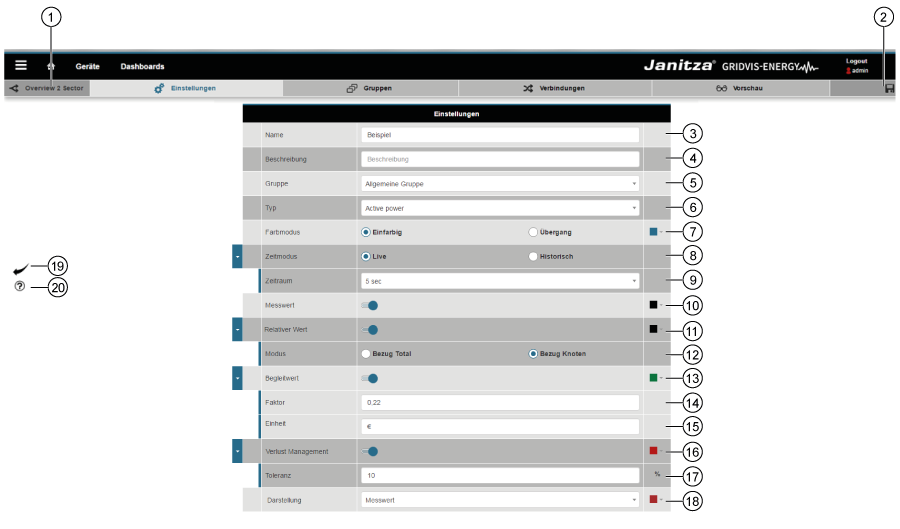
Einstellungen
| Pos. | Icon | Kurztext | Beschreibung |
|---|---|---|---|
| 1 | Name des Sankey-Diagramms. | ||
| 2 | Speichern |
| |
| 3 | Name |
| |
| 4 | Beschreibung |
| |
| 5 | Gruppe |
| |
| 6 | Typ | Voraussetzung für die Erstellung eines Sankey-Diagramms ist die Wahl des Messwerttyps.
| |
| 7 | Farbmodus | Auswahl Farbmodus für die Verbindungen:
Mit aktiviertem Radio Button Übergang werden für die Verbindungen Farben aus den Knotenfarben genutzt | |
| 8 | Zeitmodus | Auswahl Live- oder historische Werte:
| |
| 9 | Zeitraum | Der Sankey-Konfigurator verlangt den Eintrag des Zeitraums in beiden Modi (Live- und Historische-Werte).
| |
| 10 | Messwert | Bei aktiviertem Schieberegler:
| |
| 11 | Relativer Wert | Bei aktiviertem Schieberegler:
| |
| 12 | Modus | Aktivierter Radio-Button Bezug Total:
Aktivierter Radio-Button Bezug Knoten:
| |
| 13 | Begleitwert | Der Begleitwert zeigt den Messwert, multipiliziert mit einem Faktor und einer Einheit versehen. Somit lassen sich auf einen Blick z.B. Kosten (o.ä.) in den Verbindungen Ihres Sankey-Diagramms darstellen. Bei aktiviertem Schieberegler:
| |
| 14 | Faktor | Eingabefeld Faktor: Der Faktor ist der Operand, der mit Ihrem Messwert multipliziert und der entsprechenden Einheit (Pkt.15) versehen, den Begleitwert ergibt. | |
| 15 | Einheit | Eingabefeld Einheit: Einheit des Begleitwerts. | |
| 16 | Verlust Management | Bei aktiviertem Schieberegler:
| |
| 17 | Toleranz | Eingabefeld Toleranz:
| |
| 18 | Darstellung | Die Auswahlliste Darstellung besitzt 4 Einstellungen:
Die gewählte Einstellung erscheint direkt in der Verbindung des Sankey-Diagramms (siehe Beispiel Tooltipp-Anzeige folgend). | |
| 19 | Schaltfläche Zurück | Ein Klick auf die Schaltfläche, führt zurück zum Sankey-Manager | |
| 20 | Schaltfläche Hilfe |
|
Beispiel Tooltipp-Anzeige:
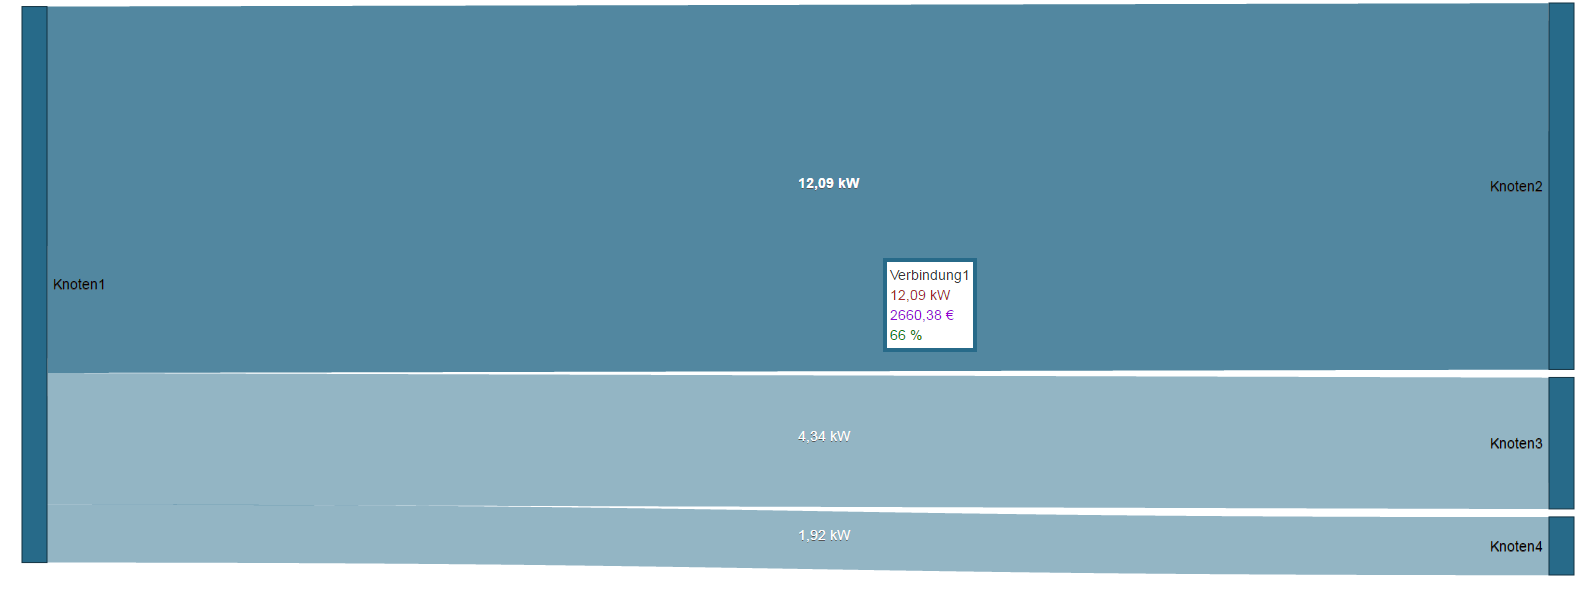
Für dieses Beispiel sind folgende Schieberegler aktiviert:
- Messwert (in kW)
- Relativer Wert (in %)
- Begleitwert (in €)
Die Einstellung der Auswahlliste Darstellung ist Messwert.
| Info | ||
|---|---|---|
| ||
In der GridVis-Desktop-Installation können Virtuelles Geräte (VD) konfiguriert werden. Mit Virtuellen Geräten kann man unterschiedliche Messwerte summieren. Das Ergebnis kann man als eigenständiges Gerät auswählen. Diese Anwendung ist sehr hilfreich, um einen fehlenden Messwert zu ersetzen. |
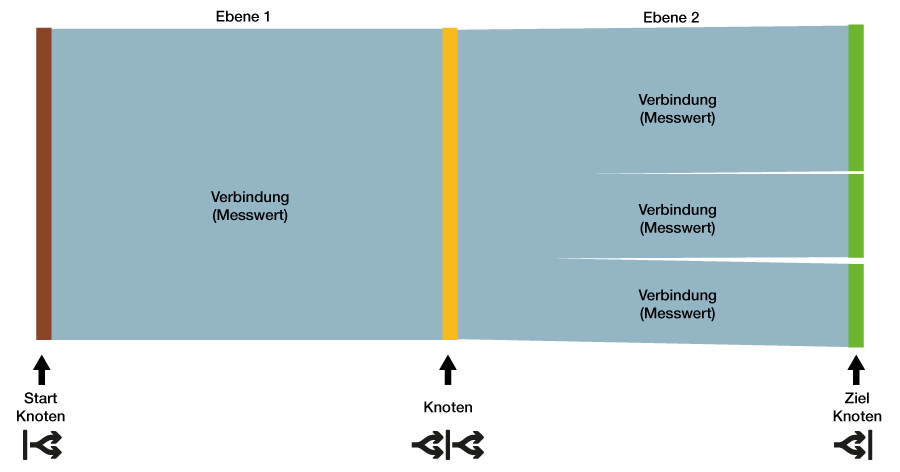
Knoten und Verbindungen - ErklärungAnker gruppen_u_verbind gruppen_u_verbind
- Eine Verbindung ist eine Fläche zwischen zwei Knoten
- Eine Verbindung stellt ein Messwert als Fläche da.
- Ein Knoten ist kein Messwert.
- Knoten sind Gruppierungen oder ein Zusammenschluss von Verbindungen (Messwerten).
- Knoten können Mehrfach Verbindungen aber auch nur eine Verbindung aufweisen.
- Knoten haben Eingangs und Ausgangsverbindungen.
- Startknoten haben immer nur Ausgangsverbindungen.
- Zielknoten haben immer nur Eingangsverbindungen.
| Bereich | Funktion | Beschreibung |
|---|---|---|
| Knoten |
| Im Sankey-Konfigurator gebildete Knoten können als Start, Zwischen oder Zielknoten definiert werden. Knoten haben eigene Farben und Namen. |
| Verbindungen |
| Die Fläche einer Verbindung zeigt das Größenverhältnis (des Messwertes) in Relation zur gesamten Ebene an. Eine Verbindung wird genutzt um zwei Knoten miteinander zu verbinden. |
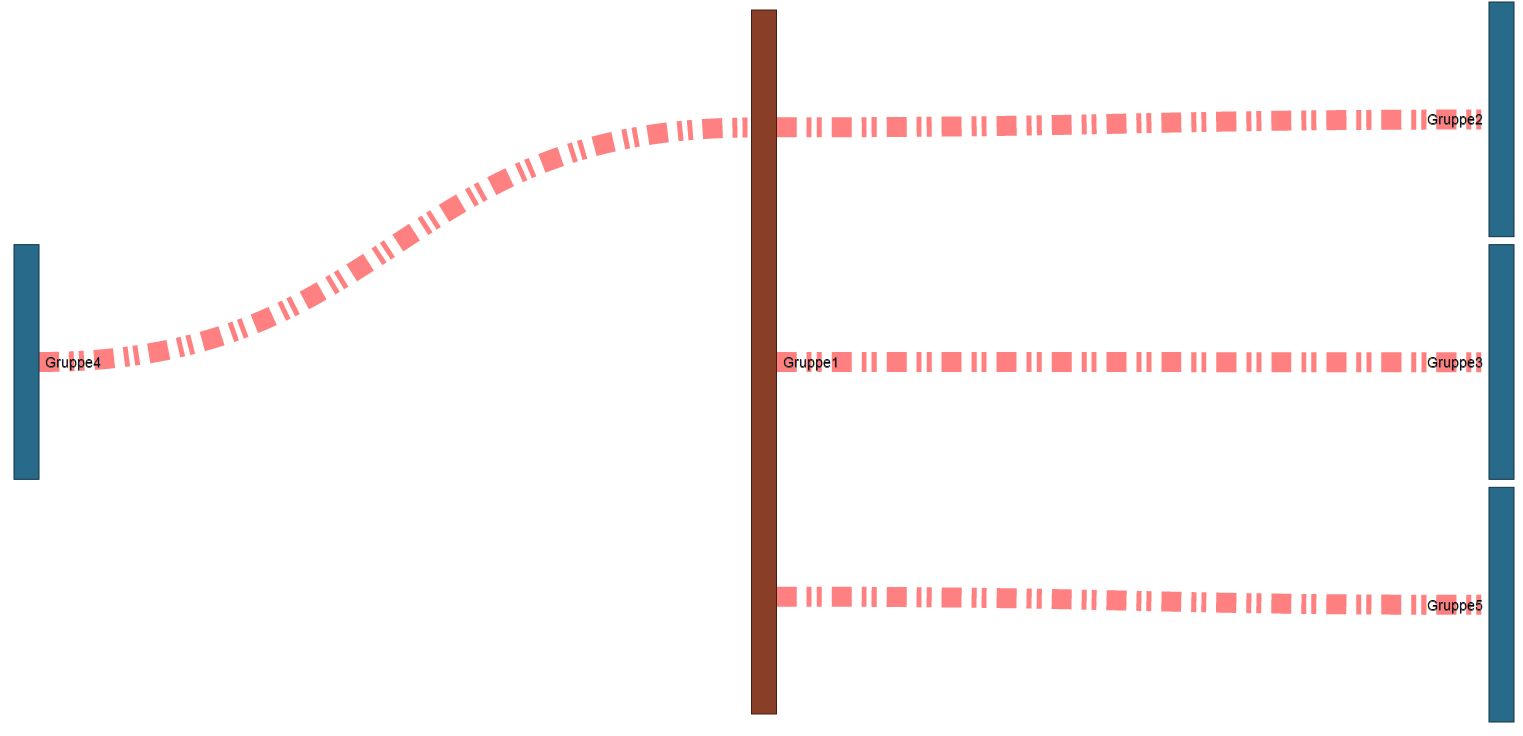
![]() Hinweis:
Hinweis:
Fehlen Messwerte für die Erstellung eines Sankey-Diagramms (z.B. Messwerte liegen in der Zukunft oder Aufzeichnungen fehlen),
zeichnet das System die Messwerte (Verbindungen) für das Sankey-Diagramm mit roten gestrichelten Linien:
| Info | ||
|---|---|---|
| ||
Für die Erstellung komplexer Sankey-Diagramme ist es wichtig und hilfreich, einzelne Knoten zu verbinden und das Ergebnis mit der Vorschau-Funktion anzuzeigen und zu prüfen! |
Knoten
Ein Knoten
- ist kein Messwert!
- stellt ein Zusammenschluss von Messwerten dar.
- wird für den Verbindungsaufbau benötigt.
Das System markiert unbenutzte Knoten. Im Fenster Verbindungen (Unternavigation > Tab Verbindungen) verbinden Sie unbenutzte Knoten und das System entfernt die Markierung.
| Info | ||
|---|---|---|
| ||
Strukturieren Sie erstellte Knoten übersichtlich! Verwenden Sie erstellte Knoten in Verbindungen am besten schon bei der Erstellung. |
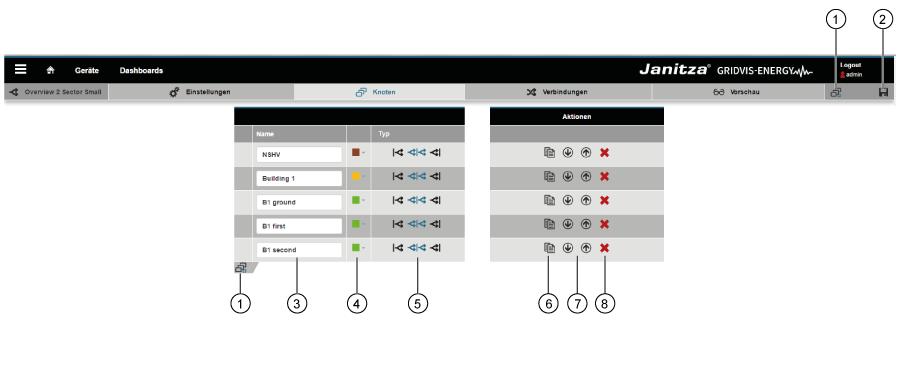
| Pos. | Icon | Kurztext | Beschreibung |
|---|---|---|---|
| 1 | Knoten hinzufügen | Neuen Knoten hinzufügen. | |
| 2 |
| Konfiguration speichern | Konfigurations-Einstellungen des Knotens speichern. |
| 3 | Name des Knoten |
| |
| 4 | Farbauswahl Knoten |
| |
| 5 | Startknoten | Definierter Knotentyp. Der ausgewählte Knotentyp wird blau dargestellt!
| |
| Knoten (Zwischenknoten) | ||
| Zielknoten | |||
| 6 | Knoten kopieren | Ein Klick auf die Schaltfläche kopiert den ausgewählten Knoten. | |
| 7 |
| Position des Knotens | Angelegten Knoten nach oben oder nach unten im Konfigurationsfenster verschieben.
|
| |||
| 8 | Knoten löschen |
|
Verbindungen
- Die Fläche einer Verbindung zeigt das Größenverhältnis (des Messwertes) in Relation zur gesamten Ebene.
- Eine Verbindung wird genutzt um zwei Knoten miteinander zu verbinden.
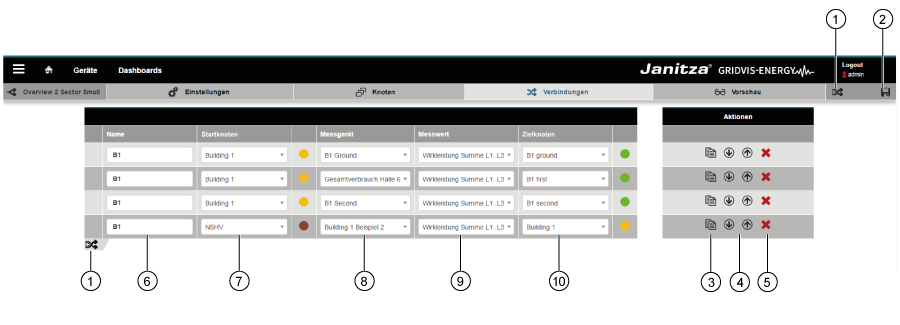
| Pos. | Icon | Kurztext | Beschreibung |
|---|---|---|---|
| 1 | Verbindung hinzufügen | Neue Verbindung hinzufügen. | |
| 2 | Verbindung speichern | Konfigurations-Einstellungen der Verbindung speichern. | |
| 3 | Verbindung kopieren | Ein Klick auf die Schaltfläche kopiert die ausgewählte Verbindung. | |
| 4 | Postion der Verbindung | Angelegte Verbindungen nach oben oder nach unten im Konfigurationsfenster verschieben.
| |
| 5 | Verbindung löschen |
| |
| 6 | Name der Verbindung | Erscheint im Sankey-Diagramm als Tooltip, wenn die Maus über die Verbindung bewegt wird. | |
| 7 | Startknoten | Zeigt die Knotentypen Start- und Zwischenknoten.
| |
| 8 | Messgeräte-Auswahl | Bei fehlenden Messgeräten können auch virtuelle Messgeräte (VD) heran gezogen werden.
| |
| 9 | Messwert-Auswahl |
| |
| 10 | Zielknoten | Zeigt die Knotentypen Ziel- und Zwischenknoten.
|
Die Vorschau-FunktionAnker vorschau vorschau
Durch einen Klick auf die Schaltfläche Vorschau in der Unternavigation erhalten Sie eine Vorschau zu Ihrem Sankey-Diagramm.
Neu erstellte Verbindungen werden in der Funktion Vorschau für das Sankey-Diagramm direkt dargestellt.
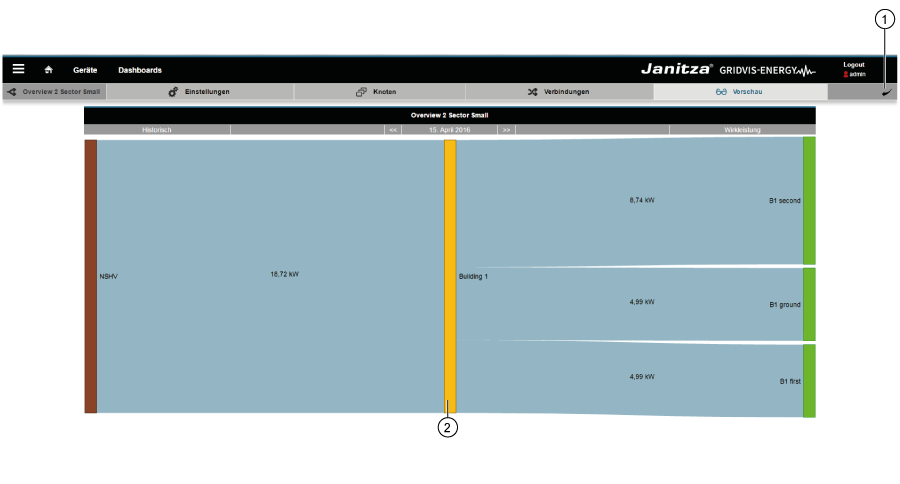
| Pos. | Icon | Kurztext | Beschreibung |
|---|---|---|---|
| 1 | Zurück | Zurück zum Sankey-Manager | |
| 2 | Vorschau | Vorschau des Sankey-Diagramms |
![]() Hinweis:
Hinweis:
Fehlen Messwerte für die Erstellung eines Sankey-Diagramms (z.B. Messwerte liegen in der Zukunft oder Aufzeichnungen fehlen),
zeichnet das System die Messwerte (Verbindungen) für das Sankey-Diagramm mit roten gestrichelten Linien:
| Tipp |
|---|
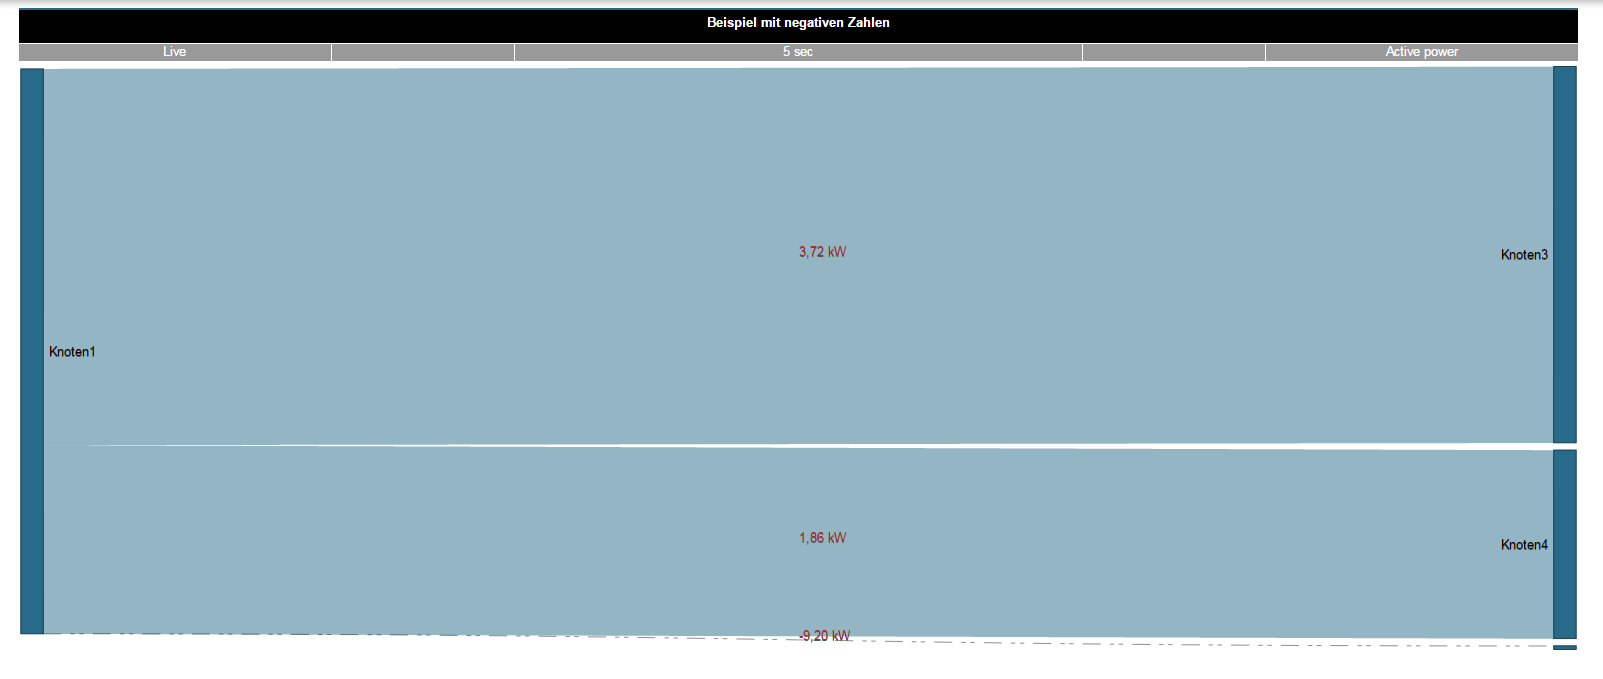
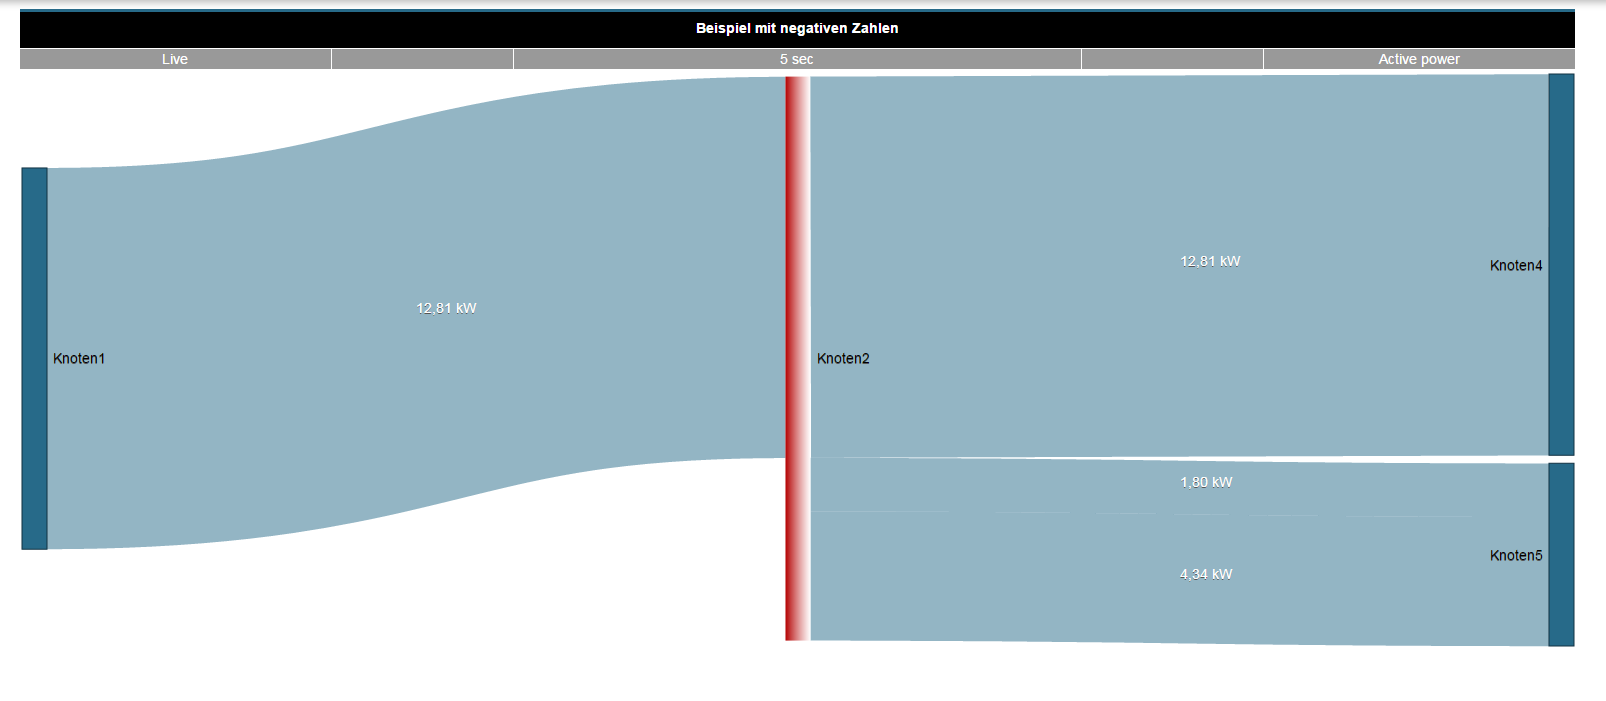
Sankey-Diagramme, die positive und negative Messwerte aufweisen zeichnen
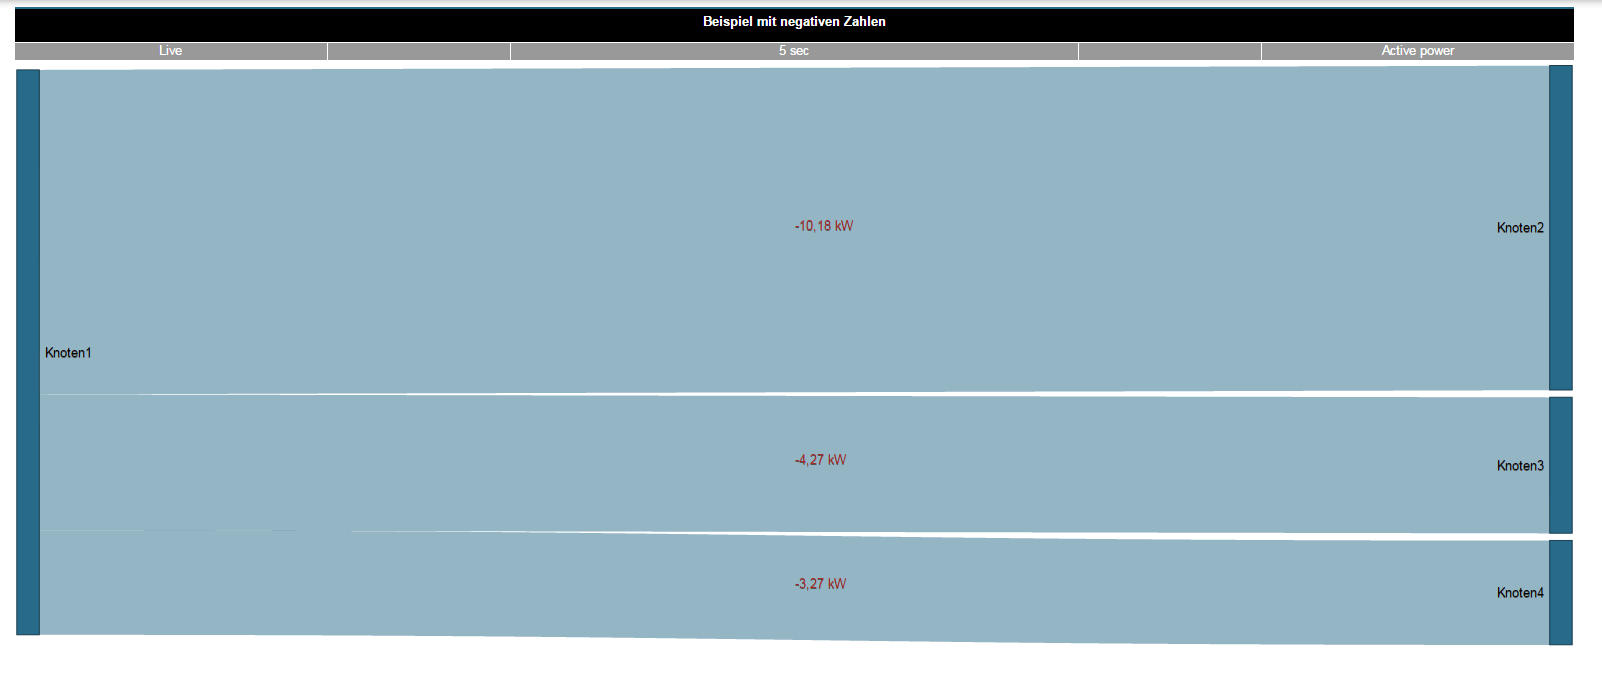
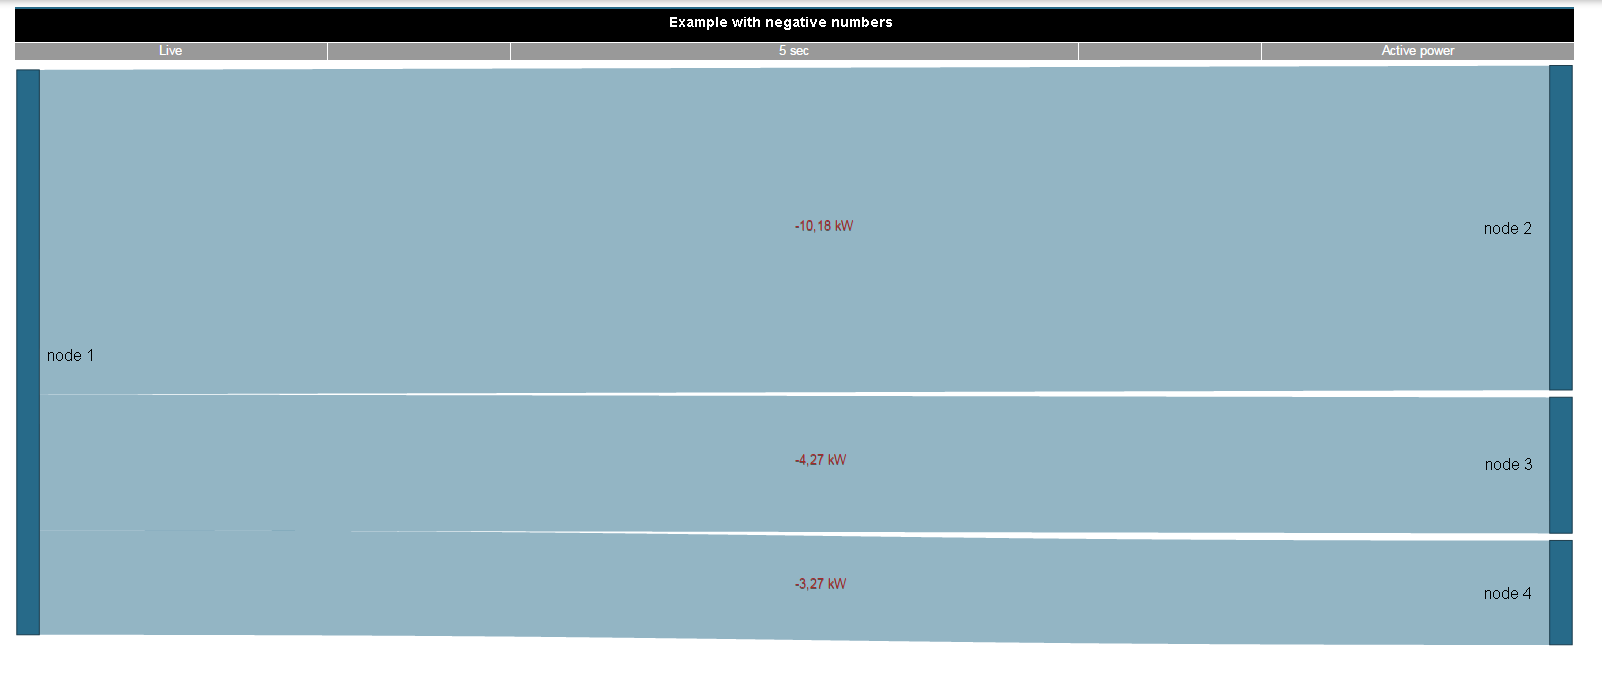
Enthält Ihr Sankey-Diagramm nur positive oder nur negative Messwerte, zeichnet das System alle Verbindungen vollständig. Ein Minus-Zeichen kennzeichnet die negativen Messwerte. |
Beispiel 1: Positive und negative Messwerte in einem Sankey-Diagramm.
Beispiel 2: Sankey-Diagramm mit ausschließlich negativen Messwerten.
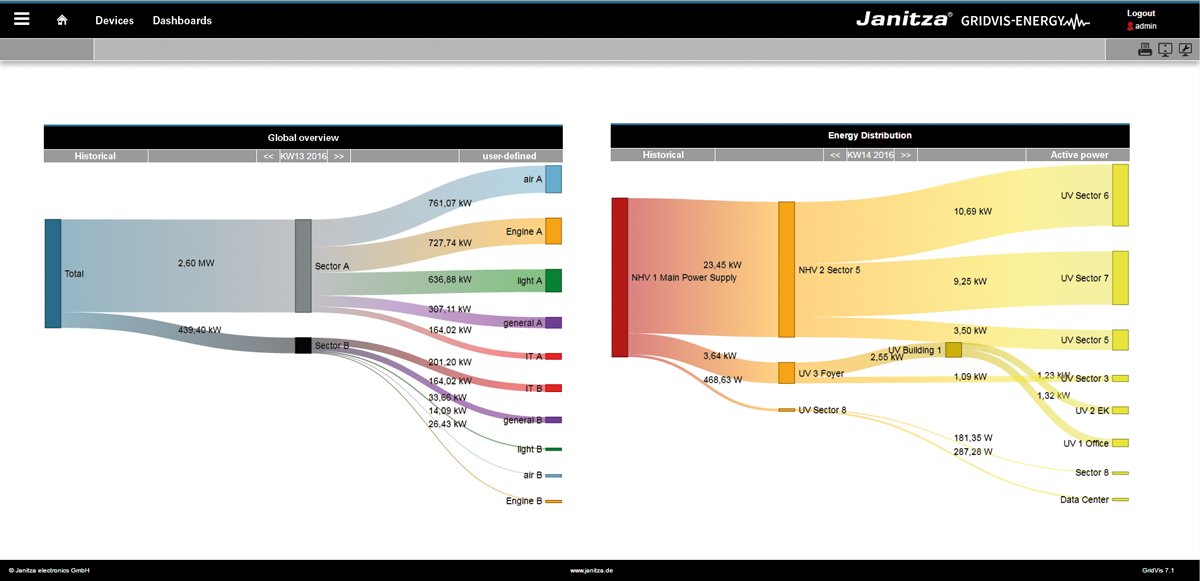
Das Sankey-WidgetAnker widget widget
Erstellte Sankey-Diagramme können als Widgets auf vorhandene oder neue Dasboards platziert werden.
Im Fenster Dashboards kann Ihr Sankey-Diagramm
- über den Namen ausgewählt werden.
- auf dem Dashboard frei positioniert und skaliert werden.
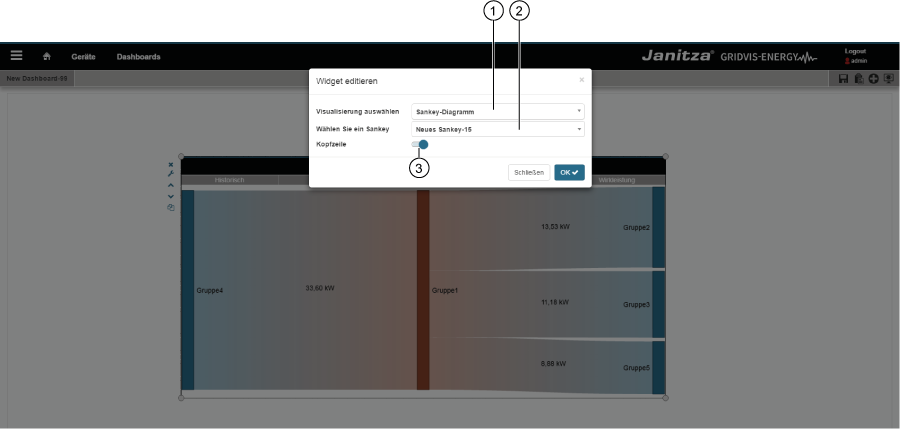
| Pos. | Icon | Kurztext | Beschreibung |
|---|---|---|---|
| 1 | Visualisierung auswählen | Auswahlliste der Visualisierung: Widget Sankey-Diagramm wählen! | |
| 2 | Wählen Sie ein Sankey | Auswahlliste aller Sankey-Diagramme | |
| 3 | Kopfzeile | Schieberegler zum ein- und ausblenden der Kopfzeile. |
Verlust Management
Das System berechnet den Verlust zwischen Eingang und Ausgang eines Knotens. Die Eingabe einer Toleranz (relativ in %) beeinflusst den Verlust. Abweichungen der Messwerte, die die eingetragene Toleranz überschreiten, zeichnet das Sankey-Diagramm als Verlust (die betreffenden Knoten pulsieren):
- Die Farbe für Verluste konfigurieren Sie über ein Dialogfeld im Fenster Einstellungen (vgl. Pkt.16, Tabelle Der Sankey-Konfigurator)
- Das System zeichnet Verluste als Flächen, die in einen Verlustknoten fließen.
- Ein Verlust-Zielknoten ist ein Zusammenschluss aller entstanden Verluste.
Bei einem pulsierenden Knoten zeigt der Farbverlauf die Richtung des Verlusts
Der Verlust entsteht von
(Verlust-Richtung):Farbverlauf des pulsierenden Knotens Bemerkung Eingang zu Ausgang Weiß zu Volltonfarbe (siehe Bsp. 1 Verlust am Knotenausgang folgend). Ausgang zu Eingang Volltonfarbe zu weiß Verluste auf der Eingangsseite zeichnet das System nicht als Fläche
(siehe Bsp. 2 Verlust am Knoteneingang folgend).Tipp Verluste, die auf der Eingangsseite auftreten, sind zumeist Anschluss- oder Konfigurationsfehler.
Somit dient das Verlust Management auch zur Plausibilitätskontrolle Ihrer Konfiguration.
Beispiel 1 Verlust am Knotenausgang
Beispiel 2 Verlust am Knoteneingang
| Sv translation | ||||||||||||||||||||||||||||||||||||||||||||||||||||||||||||||||||||||||||||||||||||||||||||||||||||||||||||||||||||||||||||||||||||||||||||||||||||||||||||||||||||||||||||||||||||||||||||||||||||||||||||||||||||||||||||||||||||||||||||||||||||||||||||||||||||||||||||||||||||||||||||||||||||||||||||||||||||||||||||||||||||||||||||||||||||||||||||||||||||||||||||||||||||||||||||||||||||||||||||||||||||||||||
|---|---|---|---|---|---|---|---|---|---|---|---|---|---|---|---|---|---|---|---|---|---|---|---|---|---|---|---|---|---|---|---|---|---|---|---|---|---|---|---|---|---|---|---|---|---|---|---|---|---|---|---|---|---|---|---|---|---|---|---|---|---|---|---|---|---|---|---|---|---|---|---|---|---|---|---|---|---|---|---|---|---|---|---|---|---|---|---|---|---|---|---|---|---|---|---|---|---|---|---|---|---|---|---|---|---|---|---|---|---|---|---|---|---|---|---|---|---|---|---|---|---|---|---|---|---|---|---|---|---|---|---|---|---|---|---|---|---|---|---|---|---|---|---|---|---|---|---|---|---|---|---|---|---|---|---|---|---|---|---|---|---|---|---|---|---|---|---|---|---|---|---|---|---|---|---|---|---|---|---|---|---|---|---|---|---|---|---|---|---|---|---|---|---|---|---|---|---|---|---|---|---|---|---|---|---|---|---|---|---|---|---|---|---|---|---|---|---|---|---|---|---|---|---|---|---|---|---|---|---|---|---|---|---|---|---|---|---|---|---|---|---|---|---|---|---|---|---|---|---|---|---|---|---|---|---|---|---|---|---|---|---|---|---|---|---|---|---|---|---|---|---|---|---|---|---|---|---|---|---|---|---|---|---|---|---|---|---|---|---|---|---|---|---|---|---|---|---|---|---|---|---|---|---|---|---|---|---|---|---|---|---|---|---|---|---|---|---|---|---|---|---|---|---|---|---|---|---|---|---|---|---|---|---|---|---|---|---|---|---|---|---|---|---|---|---|---|---|---|---|---|---|---|---|---|---|---|---|---|---|---|---|---|---|---|---|---|---|---|---|---|---|---|---|---|---|---|---|---|---|---|---|---|---|---|---|---|---|---|---|---|---|---|---|---|---|---|---|---|---|---|---|---|---|---|---|---|---|---|---|---|
| ||||||||||||||||||||||||||||||||||||||||||||||||||||||||||||||||||||||||||||||||||||||||||||||||||||||||||||||||||||||||||||||||||||||||||||||||||||||||||||||||||||||||||||||||||||||||||||||||||||||||||||||||||||||||||||||||||||||||||||||||||||||||||||||||||||||||||||||||||||||||||||||||||||||||||||||||||||||||||||||||||||||||||||||||||||||||||||||||||||||||||||||||||||||||||||||||||||||||||||||||||||||||||
|
| Anker | ||||
|---|---|---|---|---|
|
The Sankey diagram
- Visualises energy flows (quantity flows) in graphical form as diagrams.
- Connecting areas show consumption data or other measured values, proportional to the size of the measured value.
- Is simple and intuitive to create with the Sankey Configurator, and manage with the Sankey Manager.
- Can be integrated as a widget into every dashboard and evaluated.
The Sankey function consists of 3 areas:
| 1. | Sankey Manager | Management tool for Sankey diagrams. |
| 2. | Sankey Configurator | Creation of individual Sankey diagrams. |
3. | Sankey Widget | Can be placed on the dashboard. |
The Sankey ManagerAnker sankeymanager sankeymanager
The Sankey Manager is the management tool for Sankey diagrams.
The Sankey Manager
- Manages all Sankey diagrams.
- Offers a structured and informative overview of all existing Sankey diagrams.
How do I open the Sankey Manager?
- Click in the navigation bar on the "Navigation " button.
- You will find the "Sankey Manager" in the drop-down menu under "Configurators ".
"Sankey Manager" area (overview window):
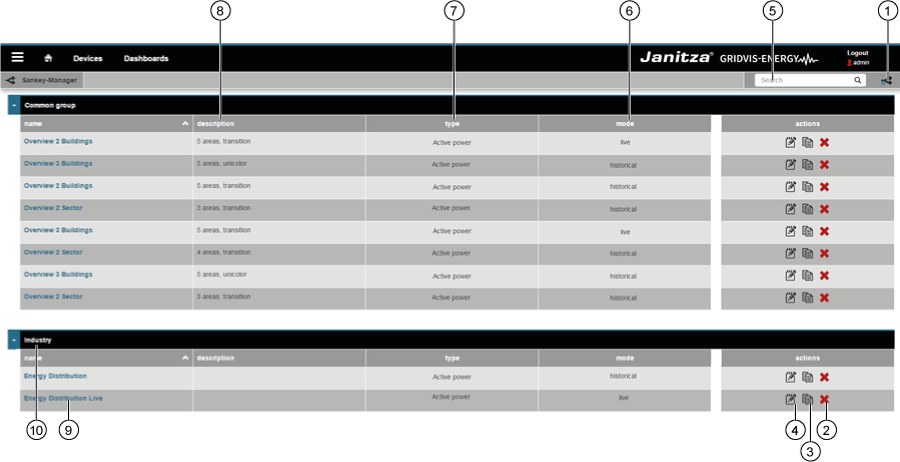
Item | Icon | Short text | Description |
|---|---|---|---|
| 1 | Create | Create new Sankey diagram. | |
| 2 | Delete | Delete Sankey diagram. | |
| 3 | Copy | Copy Sankey diagram. | |
| 4 | Open | Open Sankey Configurator. | |
| 5 | Search and filter | Search and filter Sankey diagrams. | |
| 6 | Mode | Sankey diagram mode. The Sankey diagram shows "live values" or "historical values". | |
| 7 | Type | Type of measured value (e.g. effective power). | |
| 8 | Description | Information text that has been stored with a Sankey diagram. | |
| 9 | Name | Name of the Sankey diagram. Clicking on the name opens a preview. | |
| 10 | Group | Sankey diagram group. Can be configured in the Sankey Configurator. |
The Sankey ConfiguratorAnker sankeykonfigurator sankeykonfigurator
Using the Sankey Configurator, you create your own Sankey diagrams without programming knowledge. In order to create a Sankey diagram, you create nodes and connections in the Sankey Configurator and link these with each other, according to requirement (see also description of "Nodes and links").
The Sankey Configurator
- Consists of 4 areas (settings, nodes, links and preview).
- Facilitates the creation of individual Sankey diagrams without programming knowledge, through the creation and connection of nodes and links.
- Facilitates e.g. the creation of energy flow analyses for your company without extensive time and effort. You can also select and visualise measured values such as current, effective power or harmonics. Measurement devices - e.g. from Janitza - are a prerequisite for energy flow analyses. These must be used at the desired measurement points and linked with the Sankey Configurator.
- Opens for every Sankey diagram by clicking on the button "" in the "Actions" area of the Sankey Manager (see "The Sankey Manager" screen under item 4).
Settings
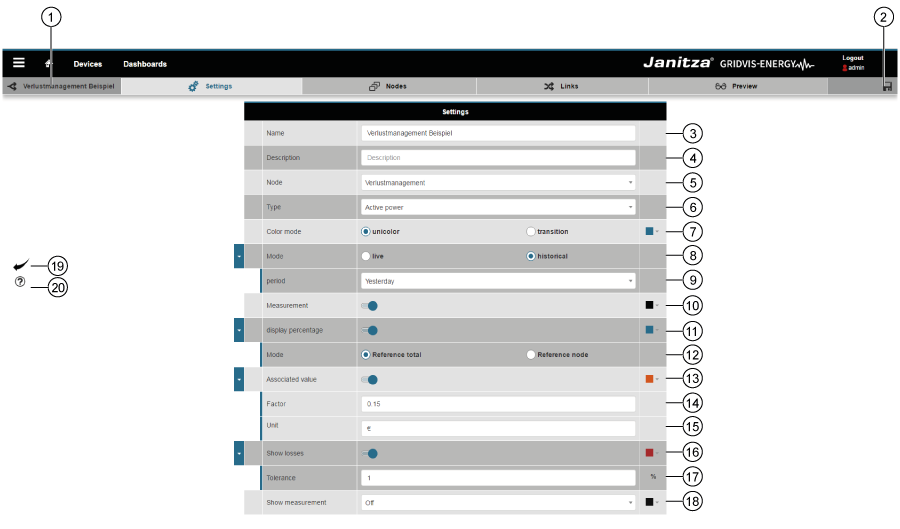
| Item | Icon | Short text | Description |
|---|---|---|---|
| 1 | Name of the Sankey diagram. | ||
| 2 | Save |
| |
| 3 | Name |
| |
| 4 | Description |
| |
| 5 | Group |
| |
| 6 | Type | A precondition for the creation of a Sankey diagram is the selection of the measured value type.
| |
| 7 | Colour mode | Selection of the colour mode for the links:
(Can be set in the “Nodes” area of the Sankey Configurator). | |
| 8 | Time mode | Choose between live or historical values:
| |
| 9 | Time period | The Sankey Configurator requires entry of the period in both modes (live and historical values).
| |
| 10 | Measured value | With activated slide control:
| |
| 11 | Relative value | With activated slide control:
| |
| 12 | Mode | Activated radio button - “Reference total”:
Activated radio button - “Reference node”:
| |
| 13 | Associated value | The associated value shows the measured value, multiplied by a factor and assigned a unit. In this way it is possible to visualise e.g. the “costs” (or similar) in your Sankey diagram links at a glance. With activated slide control:
| |
| 14 | Factor | “Factor” input field:
| |
| 15 | Unit | “Unit” input field:
| |
| 16 | Loss management | With activated slide control:
| |
| 17 | Tolerance | “Tolerance” input field:
| |
| 18 | Show measurement | The “Show measurement” selection list has 4 settings:
| |
| 19 | “Back” button | Clicking on the button takes you back to the Sankey Manager | |
| 20 | “Help” button |
|
Example of “tool tip display”:

In this example, the following slide controls are activated:
- Measured value (in kW)
- Relative value (in %)
- Associated value (in €)
The setting in the “Show measurement” selection list is “Measured value”.
| Info | ||
|---|---|---|
| ||
In the GridVis desktop installation, it is possible to configure virtual devices (VD). With virtual devices, it is possible to add up different measured values. The results can be selected as an independent device. This application is very helpful in order to replace a missing measured value. |
Nodes and links - explanationAnker gruppen_u_verbind gruppen_u_verbind
- A link is an area between two nodes
- A link presents a measured value as an area.
- A node is not a measured value.
- Nodes are groupings or a combination of links (measured values).
- Nodes can exhibit multiple links or just a single link.
- Nodes have input and output links.
- Start nodes only ever have output links.
- Target nodes only ever have input links.

Area | Function | Description |
|---|---|---|
Nodes |
|
|
Links |
|
|
![]() Note:
Note:
If measured values required for the creation of a Sankey diagram are missing (e.g. measured values lie in the future or recordings are missing),
the system plots the measured values (links) for the Sankey diagram with dotted red lines:
| Info | ||
|---|---|---|
| ||
In order to generate complex Sankey diagrams it is important and helpful to link individual nodes, and to display and check the results using the “preview” function! |
Nodes
A node
- is not a measured value!
- constitutes a combination of measured values.
- is required for establishing the link.
The system marks unused nodes. In the “Links” window (sub-navigation > "Links" tab), you link unused nodes and the system removes the marking.
| Info | ||
|---|---|---|
| ||
Structure the nodes created in a clear manner! Use created nodes in links ideally when these are first created. |

| Item | Icon | Short text | Description |
|---|---|---|---|
| 1 | Insert node | Insert new node | |
| 2 |
| Save configuration | Save configuration settings of the node. |
| 3 | Node name |
| |
| 4 | Node colour selection |
| |
| 5 | Start node | Defined node type. The selected node type is displayed in “blue”!
| |
| Node (intermediate node) | ||
| Target node | |||
| 6 | Copy node | Clicking on the button copies the selected node. | |
| 7 |
| Position of the node | Shift created nodes up or down in the configuration window.
|
| |||
| 8 | Delete node |
|
Links
- The area of a link shows the size relationship (of the measured value) in relation to the entire level.
- A link is used to connect two nodes with each other.
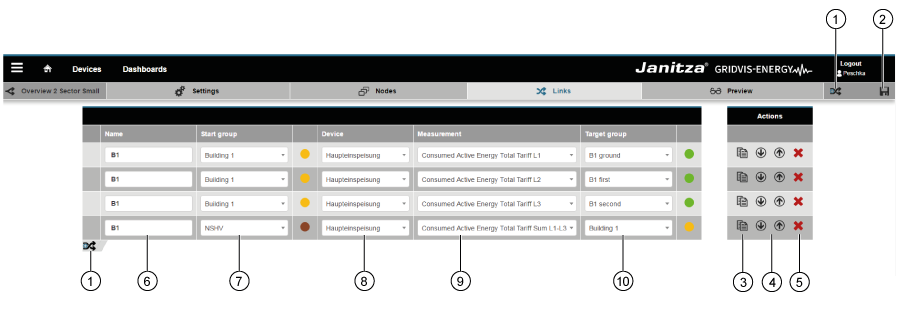
| Item | Icon | Short text | Description |
|---|---|---|---|
| 1 | Insert link | Insert new link. | |
| 2 | Save link | Save configuration settings of the link. | |
| 3 | Copy link | Clicking on the button copies the selected link. | |
| 4 | Position of the link | Shift created links up or down in the configuration window.
This function
| |
| 5 | Delete link |
Deleted links cannot be restored! | |
| 6 | Name of the link | Appears in the Sankey diagram as a tool tip, if the mouse is moved over the link. | |
| 7 | Start node | Shows the node types start and intermediate node.
| |
| 8 | Measuring devices selection |
| |
| 9 | Measured value selection |
| |
| 10 | Target node | Shows the node types target and intermediate node.
|
The preview functionAnker vorschau vorschau
Clicking on the “Preview” button in the sub-navigation provides you with a preview of your Sankey diagram.
Newly created links are directly shown in the “Preview” function for the Sankey diagram.
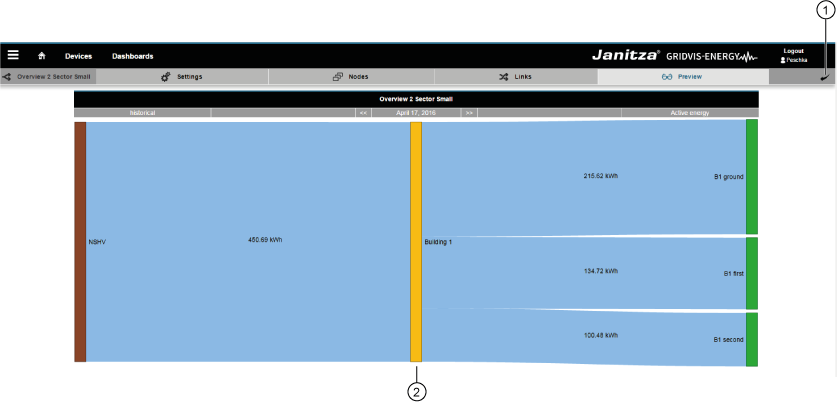
| Item | Icon | Short text | Description |
|---|---|---|---|
| 1 | Back | Go back to the Sankey Manager | |
| 2 | Preview | Preview of the Sankey diagram. |
![]() Note:
Note:
If measured values required for the creation of a Sankey diagram are missing (e.g. measured values lie in the future or recordings are missing),
the system plots the measured values (links) for the Sankey diagram with dotted red lines:
| Tipp | ||
|---|---|---|
| ||
Plot Sankey diagrams that show positive and negative measured values
If your Sankey diagram contains only positive or only negative measured values then the system plots all links in full. A “minus sign” indicates the negative measured values. |
Example 1: Positive and negative measured values in a Sankey diagram.
Example 2: Sankey diagram with exclusively negative measured values.
The Sankey WidgetAnker widget widget
Once created, Sankey diagrams can be placed on existing or new dashboards as widgets.
In the “Dashboards” window, your Sankey diagram can be
- selected via its name.
- freely positioned on the dashboard and scaled.

| Item | Icon | Short text | Description |
|---|---|---|---|
| 1 | Select visualisation | Visualisation selection list: Select "Sankey diagram" widget! | |
| 2 | Choose a Sankey | Selection list with all Sankey diagrams | |
| 3 | Header | Slide control for showing or hiding the header. |
Loss management
The system calculates the loss between the input and output of a node. Inputting a tolerance (relative in %) influences the loss. Deviations from the measured values, which exceed the entered tolerance, are plotted on the Sankey diagram as losses (the affected nodes pulsate):
- You configure the colour of “Losses” via a dialogue field in the “Settings” window (see point 16, table “The Sankey Configurator”)
- The system plots losses as areas, which flow into a loss node.
- A loss target node is a combination of all losses that have arisen.
- With a pulsating node, the colour gradient shows the direction of the loss.
| The loss arises from (loss direction): | Colour gradient of the pulsating node | Comment |
|---|---|---|
Input to output | White to full-tone colour | (see example 1 “Loss at the node output” in the following). |
Output to input | Full-tone colour to white | The system does not plot losses on the input side as areas |
| Tipp | ||
|---|---|---|
| ||
|
Example 1 “Loss at the node output”
Example 2 “Loss at the node input”

| Sv translation | ||||||||||||||||||||||||||||||||||||||||||||||||||||||||||||||||||||||||||||||||||||||||||||||||||||||||||||||||||||||||||||||||||||||||||||||||||||||||||||||||||||||||||||||||||||||||||||||||||||||||||||||||||||||||||||||||||||||||||||||||||||||||||||||||||||||||||||||||||||||||||||||||||||||||||||||||||||||||||||||||||||||||||||||||||||||||||||||||||||||||||||||||||||||||||||||||||||||||||||||||||||
|---|---|---|---|---|---|---|---|---|---|---|---|---|---|---|---|---|---|---|---|---|---|---|---|---|---|---|---|---|---|---|---|---|---|---|---|---|---|---|---|---|---|---|---|---|---|---|---|---|---|---|---|---|---|---|---|---|---|---|---|---|---|---|---|---|---|---|---|---|---|---|---|---|---|---|---|---|---|---|---|---|---|---|---|---|---|---|---|---|---|---|---|---|---|---|---|---|---|---|---|---|---|---|---|---|---|---|---|---|---|---|---|---|---|---|---|---|---|---|---|---|---|---|---|---|---|---|---|---|---|---|---|---|---|---|---|---|---|---|---|---|---|---|---|---|---|---|---|---|---|---|---|---|---|---|---|---|---|---|---|---|---|---|---|---|---|---|---|---|---|---|---|---|---|---|---|---|---|---|---|---|---|---|---|---|---|---|---|---|---|---|---|---|---|---|---|---|---|---|---|---|---|---|---|---|---|---|---|---|---|---|---|---|---|---|---|---|---|---|---|---|---|---|---|---|---|---|---|---|---|---|---|---|---|---|---|---|---|---|---|---|---|---|---|---|---|---|---|---|---|---|---|---|---|---|---|---|---|---|---|---|---|---|---|---|---|---|---|---|---|---|---|---|---|---|---|---|---|---|---|---|---|---|---|---|---|---|---|---|---|---|---|---|---|---|---|---|---|---|---|---|---|---|---|---|---|---|---|---|---|---|---|---|---|---|---|---|---|---|---|---|---|---|---|---|---|---|---|---|---|---|---|---|---|---|---|---|---|---|---|---|---|---|---|---|---|---|---|---|---|---|---|---|---|---|---|---|---|---|---|---|---|---|---|---|---|---|---|---|---|---|---|---|---|---|---|---|---|---|---|---|---|---|---|---|---|---|---|---|---|---|---|---|---|---|---|---|---|---|---|---|---|---|---|---|
| ||||||||||||||||||||||||||||||||||||||||||||||||||||||||||||||||||||||||||||||||||||||||||||||||||||||||||||||||||||||||||||||||||||||||||||||||||||||||||||||||||||||||||||||||||||||||||||||||||||||||||||||||||||||||||||||||||||||||||||||||||||||||||||||||||||||||||||||||||||||||||||||||||||||||||||||||||||||||||||||||||||||||||||||||||||||||||||||||||||||||||||||||||||||||||||||||||||||||||||||||||||
|
| Anker | ||||
|---|---|---|---|---|
|
Diagrama Sankey
- Los flujos de energía (flujos de cantidad) se muestran gráficamente mediante diagramas.
- Las áreas de conexión muestran datos de consumo u otros valores de medición de manera proporcional a la magnitud del valor de medición.
- Puede crearse fácil e intuitivamente con el configurador de Sankey y administrarse con el administrador de Sankey.
- Puede integrarse como widget en cualquier panel y evaluarse.
La función Sankey se compone de tres paneles:
| 1. | Administrador de Sankey | Herramienta de gestión de diagramas Sankey. |
| 2. | Configurador de Sankey | Creación de diagramas Sankey personalizados. |
3. | Widget de Sankey | Puede colocarse en el panel. |
Administrador de SankeyAnker sankeymanager sankeymanager
El administrador de Sankey es la herramienta de gestión de diagramas Sankey.
El administrador de Sankey se encarga de las siguientes tareas:
- Administra todos los diagramas Sankey.
- Proporciona una vista general estructurada e informativa de todos los diagramas Sankey existentes.
¿Cómo abro el administrador de Sankey?
- Haga clic en el botón «Navegación » de la barra de navegación.
- Puede acceder al «Administrador de Sankey » desde el menú desplegable en «Configuradores ».
Panel «Administrador de Sankey» (ventana de vista general):
| Pos. | Icono | Texto breve | Descripción |
|---|---|---|---|
| 1 | crear | Creación de un nuevo diagrama Sankey. | |
| 2 | eliminar | Eliminación de un diagrama Sankey. | |
| 3 | copiar | Copiado de un diagrama Sankey. | |
| 4 | abrir | Apertura del configurador de Sankey. | |
| 5 | buscar y filtrar | Búsqueda y filtrado de un diagrama Sankey. | |
| 6 | Modo | Modo del diagrama Sankey. El diagrama Sankey muestra «valoresen tiempo real» o ««valoresdel historial». | |
| 7 | Tipo | Tipo del valor de medición (p. ej., potencia activa). | |
| 8 | Descripción | Texto informativo sobre un diagrama Sankey guardado anteriormente. | |
| 9 | Nombre | Nombre del diagrama Sankey. Haciendo clic en el nombre se abre una vista previa. | |
| 10 | Grupo | Grupo del diagrama Sankey. Puede configurarse en el configurador de Sankey. |
Configurador de SankeyAnker sankeykonfigurator sankeykonfigurator
Con el configurador de Sankey puede crear sus propios diagramas Sankey aunque no tenga conocimientos de programación. Para dibujar un diagrama Sankey, utilice el configurador de Sankey para crear nodos y conexiones, y vincularlos unos con otros en función de sus necesidades (véase también la descripción «Nodos y conexiones»).
El configurador de Sankey se caracteriza por los siguientes aspectos:
- Está compuesto por cuatro paneles (ajustes, nodos, conexiones y vista previa).
- Sirve para ajustar diagramas Sankey personalizados —sin requerir conocimientos de programación— mediante la creación y vinculación de nodos y conexiones.
- Sirve, por ejemplo, para crear análisis del flujo de la energía de su empresa sin gran esfuerzo. También puede seleccionar y visualizar valores de medición, como la corriente, la potencia activa o las oscilaciones superiores. El requisito para realizar análisis del flujo de la energía consiste en emplear dispositivos de medición de, por ejemplo, la empresa Janitza. Estos deben colocarse en los puntos de medición deseados y vincularse por medio del configurador de Sankey.
- Se abre para cada diagrama Sankey haciendo clic en el botón «» del panel de «acciones» del administrador de Sankey.
(véase la pantalla «Administrador de Sankey» en la pos. 4).
Ajustes
| Pos. | Icono | Texto breve | Descripción |
|---|---|---|---|
| 1 | Nombre del diagrama Sankey. | ||
| 2 | Guardar |
| |
| 3 | Nombre |
| |
| 4 | Descripción |
| |
| 5 | Grupo |
| |
| 6 | Tipo | El requisito para crear un diagrama Sankey consiste en elegir el tipo de valor de medición.
| |
| 7 | Modo de color | Selección del modo de color para las conexiones:
Para las conexiones pueden emplearse los colores de los nodos con el botón de selección «Traspaso» activado | |
| 8 | Modo de tiempo | Selección de los valores del historial y en tiempo real:
| |
| 9 | Periodo de tiempo | El configurador de Sankey requiere introducir el periodo de tiempo en ambos modos (valores del historial y en tiempo real).
| |
| 10 | Valor de medición | Si el control deslizante está activado, tienen lugar las siguientes acciones:
| |
| 11 | Valor relativo | Si el control deslizante está activado, tienen lugar las siguientes acciones:
| |
| 12 | Modo | Botón de selección «Consumo total» activado:
Botón de selección «Nodos de consumo» activado:
| |
| 13 | Valor asociado | El valor asociado muestra el valor de medición multiplicado por un factor y provisto de una unidad; así, por ejemplo, pueden visualizarse de un vistazo «costes» (o magnitudes similares) en las conexiones de su diagrama Sankey. Si el control deslizante está activado, tienen lugar las siguientes acciones:
| |
| 14 | Factor | Campo de entrada «Factor»: El factor es el operando que se multiplica por su valor de medición y da como resultado el valor asociado en función de la unidad (punto 15) de que disponga. | |
| 15 | Unidad | Campo de entrada «Unidad»: Unidad del valor asociado. | |
| 16 | Gestión de pérdidas | Si el control deslizante está activado, tienen lugar las siguientes acciones:
| |
| 17 | Tolerancia | Campo de entrada «Tolerancia»:
| |
| 18 | Visualización | La lista de selección «Visualización» cuentan con cuatro ajustes:
El ajuste seleccionado aparece directamente en la conexión del diagrama Sankey (véase el ejemplo de «indicador de información sobre herramientas», mostrado más abajo). | |
| 19 | Botón «Atrás» | Haciendo clic en el botón se vuelve al administrador de Sankey | |
| 20 | Botón «Ayuda» |
|
Ejemplo de «indicador de información sobre herramientas»:
Para este ejemplo están activados los siguientes controles deslizantes:
- Valor de medición (en kW)
- Valor relativo (en porcentaje)
- Valor asociado (en euros)
El ajuste de la lista de selección «Visualización» es «Valor de medición».
| Info | ||
|---|---|---|
| ||
En la instalación de GridVis Desktop pueden configurarse dispositivos virtuales (VD) . Con losdispositivos virtualespueden sumarse distintos valores de medición. El resultado correspondiente puede seleccionarse como dispositivo independiente. Esta aplicación es muy útil para sustituir un valor de medición que falte. |
Nodos y conexiones: explicaciónAnker gruppen_u_verbind gruppen_u_verbind
- Unaconexión es un área entre dos nodos
- Una conexión representa un valor de medición como área.
- Unnodo no es un valor de medición.
- Los nodos son agrupamientos o una unión de conexiones (valores de medición).
- Los nodos pueden presentar varias conexiones o únicamente una conexión.
- Los nodosposeen conexiones de entrada y salida.
- Los nodos iniciales poseen exclusivamente conexiones de salida.
- Los nodos de destino poseen exclusivamente conexiones de entrada.
| Panel | Función | Descripción |
|---|---|---|
| Nodos |
| En el configurador de Sankey pueden definirse los nodos creados como nodos iniciales, intermedios o de destino. Los nodos poseen colores y nombres propios. |
| Conexiones |
| El área de una conexión muestra la relación de aspecto (del valor de medición) en relación con el plano en su conjunto. Se emplea una conexión para conectar dos nodos entre sí. |
![]() Nota:
Nota:
Si faltan valores de medición para crear un diagrama Sankey (p. ej., los valores de medición se encuentran en el futuro o faltan registros),
el sistema representa los valores de medición (conexiones) para el diagrama Sankey por medio de líneas rojas discontinuas:
| Info | ||
|---|---|---|
| ||
¡Para crear diagramas Sankey complejos, resulta importante y útil conectar los distintos nodos, así como visualizar y verificar el resultado con la «función de vista previa»! |
Nodos
Un nodo se caracteriza por los siguientes aspectos:
- ¡no es ningún valor de medición!
- representa una unión de valores de medición.
- se necesita para establecer conexiones.
El sistema marca los nodos que no se estén usando. En la ventana «Conexiones» (Subnavegación > pestaña «Conexiones») puede conectar los nodos que no se estén usando, y el sistema borra el marcado.
| Info | ||
|---|---|---|
| ||
¡Estructure los nodos creados de una manera clara! Lo ideal es que, desde su creación, use los nodos creados en conexiones. |
| Pos. | Icono | Texto breve | Descripción |
|---|---|---|---|
| 1 | Añadir nodo | Añadir nuevo nodo. | |
| 2 |
| Guardar configuración | Guardar los ajustes de configuración del nodo. |
| 3 | Nombre del nodo |
| |
| 4 | Selección del color de los nodos |
| |
| 5 | Nodo inicial | Tipo de nodo definido. ¡El tipo de nodo seleccionado se muestra en color «azul»!
| |
| Nodos (nodos intermedios) | ||
| Nodos de destino | |||
| 6 | Copiar nodo | Haciendo clic en el botón, se copia el nodo seleccionado. | |
| 7 |
| Posición del nodo | Los nodos creados pueden moverse hacia arriba o abajo en la ventana de configuración.
|
| |||
| 8 | Eliminar nodo |
|
Conexiones
- El área de una conexión muestra la relación de aspecto (del valor de medición) en relación con el plano en su conjunto.
- Se emplea una conexión para conectar dos nodos entre sí.
| Pos. | Icono | Texto breve | Descripción |
|---|---|---|---|
| 1 | Añadir conexión | Añadir una nueva conexión. | |
| 2 | Guardar conexión | Guardar los ajustes de configuración de la conexión. | |
| 3 | Copiar conexión | Haciendo clic en el botón, se copia la conexión seleccionada. | |
| 4 | Posición de la conexión | Las conexiones creadas pueden moverse hacia arriba o abajo en la ventana de configuración.
| |
| 5 | Eliminar conexión |
| |
| 6 | Nombre de la conexión | Aparece en el diagrama Sankey como información sobre herramientas si se pasa el ratón por encima de la conexión. | |
| 7 | Nodo inicial | Se muestran los siguientes tipos de nodos: inicial e intermedio.
| |
| 8 | Selección de dispositivos de medición | En caso de faltar dispositivos de medición, también se puede recurrir a dispositivos de medición virtuales (VD).
| |
| 9 | Selección de valores de medición | El tipo de valor de medición (véase la pos. 6 del apartado «Configurador de Sankey») elegido en la ventana «Ajustes» tiene efecto en la selección. Usted solo dispone de la selección completa de todos los valores de medición con el tipo (de valor de medición) «Definido por el usuario». | |
| 10 | Nodo de destino | Se muestran los siguientes tipos de nodos: intermedio y de destino.
|
Función de vista previaAnker vorschau vorschau
Haciendo clic en el botón «Vista previa» de la subnavegación se accede a una vista previa de su diagrama Sankey.
Las conexiones creadas recientemente se visualizan directamente en la función «Vista previa» para el diagrama Sankey.
| Pos. | Icono | Texto breve | Descripción |
|---|---|---|---|
| 1 | Atrás | Se vuelve al administrador de Sankey | |
| 2 | Vista previa | Vista previa del diagrama Sankey |
![]() Nota:
Nota:
Si faltan valores de medición para crear un diagrama Sankey (p. ej., los valores de medición se encuentran en el futuro o faltan registros),
el sistema representa los valores de medición (conexiones) para el diagrama Sankey por medio de líneas rojas discontinuas:
| Tipp |
|---|
Los diagramas Sankey que posean valores de medición positivos y negativos representan dichos valores de la siguiente manera:
Si su diagrama Sankey contiene solo valores de medición positivos o solo negativos, el sistema representa todas las conexiones de manera íntegra. Un «signo negativo» indica los valores de medición negativos. |
Ejemplo 1: valores de medición positivos y negativos en un diagrama Sankey.
Ejemplo 2: diagrama Sankey con únicamente valores de medición negativos.
Widget de SankeyAnker widget widget
Los diagramas Sankey creados pueden colocarse en paneles nuevos o ya existentes como widgets.
En la ventana «Paneles» puede hacer lo siguiente con su diagrama Sankey:
- seleccionarlo mediante el nombre.
- colocarlo como desee en el panel y escalarlo.
| Pos. | Icono | Texto breve | Descripción |
|---|---|---|---|
| 1 | Seleccionar visualización | Lista de selección de la visualización: ¡elija el widget «Diagrama Sankey»! | |
| 2 | Elija un Sankey | Lista de selección de todos los diagramas Sankey | |
| 3 | Encabezado | Control deslizante para mostrar y ocultar el encabezado. |
Gestión de pérdidas
El sistema calcula la pérdida que se produce entre la entrada y la salida de un nodo. Introducir una tolerancia (relativa y expresada en porcentaje) influye en la pérdida. El diagrama Sankey representa como pérdida las desviaciones de los valores de medición que rebasen la tolerancia introducida (parpadean los nodos afectados):
- Puede configurar el color para las «pérdidas» mediante el cuadro de diálogo de la ventana «Ajustes» (véase el punto 16 de la tabla «Configurador de Sankey»)
- El sistema representa las pérdidas como áreas que fluyen hacia un nodo de pérdidas.
- Un nodo de destino de pérdidases una unión de todas las pérdidas que se hayan producido.
Si parpadea un nodo, el gradiente muestra la dirección de la pérdida.
Inicio y destino de la pérdida
(dirección de la pérdida):Gradiente del nodo que parpadea Observación Desde la entrada hasta la salida Desde el color blanco hasta un color sólido (véase el ejemplo 1 con el título «Pérdida en la salida del nodo», que se muestra más abajo). Desde la salida hasta la entrada Desde un color sólido hasta el color blanco El sistema no representa como área las pérdidas que se producen en la entrada
(véase el ejemplo 2 con el título «Pérdida en la entrada del nodo», que se muestra más abajo).Tipp Las pérdidas que se producen en la entrada son, en la mayoría de los casos, errores de configuración o conexión.
Así, la «gestión de pérdidas» también sirve para revisar la viabilidad de su configuración.
Ejemplo 1: «Pérdida en la salida del nodo»
Ejemplo 2: «Pérdida en la entrada del nodo»
| Sv translation | ||||||||||||||||||||||||||||||||||||||||||||||||||||||||||||||||||||||||||||||||||||||||||||||||||||||||||||||||||||||||||||||||||||||||||||||||||||||||||||||||||||||||||||||||||||||||||||||||||||||||||||||||||||||||||||||||||||||||||||||||||||||||||||||||||||||||||||||||||||||||||||||||||||||||||||||||||||||||||||||||||||||||||||||||||||||||||||||||||||||||||||||||||||||||||||||||||||||||||||||||||||
|---|---|---|---|---|---|---|---|---|---|---|---|---|---|---|---|---|---|---|---|---|---|---|---|---|---|---|---|---|---|---|---|---|---|---|---|---|---|---|---|---|---|---|---|---|---|---|---|---|---|---|---|---|---|---|---|---|---|---|---|---|---|---|---|---|---|---|---|---|---|---|---|---|---|---|---|---|---|---|---|---|---|---|---|---|---|---|---|---|---|---|---|---|---|---|---|---|---|---|---|---|---|---|---|---|---|---|---|---|---|---|---|---|---|---|---|---|---|---|---|---|---|---|---|---|---|---|---|---|---|---|---|---|---|---|---|---|---|---|---|---|---|---|---|---|---|---|---|---|---|---|---|---|---|---|---|---|---|---|---|---|---|---|---|---|---|---|---|---|---|---|---|---|---|---|---|---|---|---|---|---|---|---|---|---|---|---|---|---|---|---|---|---|---|---|---|---|---|---|---|---|---|---|---|---|---|---|---|---|---|---|---|---|---|---|---|---|---|---|---|---|---|---|---|---|---|---|---|---|---|---|---|---|---|---|---|---|---|---|---|---|---|---|---|---|---|---|---|---|---|---|---|---|---|---|---|---|---|---|---|---|---|---|---|---|---|---|---|---|---|---|---|---|---|---|---|---|---|---|---|---|---|---|---|---|---|---|---|---|---|---|---|---|---|---|---|---|---|---|---|---|---|---|---|---|---|---|---|---|---|---|---|---|---|---|---|---|---|---|---|---|---|---|---|---|---|---|---|---|---|---|---|---|---|---|---|---|---|---|---|---|---|---|---|---|---|---|---|---|---|---|---|---|---|---|---|---|---|---|---|---|---|---|---|---|---|---|---|---|---|---|---|---|---|---|---|---|---|---|---|---|---|---|---|---|---|---|---|---|---|---|---|---|---|---|---|---|---|---|---|---|---|---|---|---|
| ||||||||||||||||||||||||||||||||||||||||||||||||||||||||||||||||||||||||||||||||||||||||||||||||||||||||||||||||||||||||||||||||||||||||||||||||||||||||||||||||||||||||||||||||||||||||||||||||||||||||||||||||||||||||||||||||||||||||||||||||||||||||||||||||||||||||||||||||||||||||||||||||||||||||||||||||||||||||||||||||||||||||||||||||||||||||||||||||||||||||||||||||||||||||||||||||||||||||||||||||||||
|
| Anker | ||||
|---|---|---|---|---|
|
Il diagramma Sankey
- Illustra graficamente i flussi di energia (flussi di quantità) sotto forma di diagrammi.
- Le superfici di collegamento mostrano i dati di consumo o altre letture proporzionali alla dimensione del valore misurato.
- Possono essere creati in modo semplice e intuitivo con il Configuratore Sankey e gestiti con il Manager Sankey.
- Può essere integrato in qualsiasi dashboard come widget e interpretato.
La funzione Sankey è composta da 3 aree:
| 1. | Manager Sankey | Strumento di gestione dei diagrammi Sankey. |
| 2. | Configuratore Sankey | Creazione di diagrammi Sankey personalizzati. |
3. | Widget Sankey | Può essere posizionato sulla dashboard. |
Il Manager SankeyAnker sankeymanager sankeymanager
Il Manager Sankey è lo strumento di gestione dei diagrammi Sankey.
Il Manager Sankey
- Gestisce tutti i diagrammi Sankey.
- Fornisce una panoramica strutturata e informativa di tutti i diagrammi Sankey esistenti.
Come si apre il Manager Sankey?
- Fare clic sul pulsante “Navigazione“ nella barra di navigazione .
- Il “Manager Sankey “ è raggiungibile dal menu a discesa in “Configuratori “.
Area “Manager Sankey“ (finestra riepilogativa):
| Pos. | Icona | Testo breve | Descrizione |
|---|---|---|---|
| 1 | creare | Creare un nuovo diagramma Sankey. | |
| 2 | cancella | Cancellare un diagramma di Sankey. | |
| 3 | copia | Copiare un diagramma di Sankey. | |
| 4 | apri | Aprire il configuratore Sankey | |
| 5 | Ricerca e filtro | Cercare e filtrare i diagrammi Sankey. | |
| 6 | Modalità | Modalità del diagramma Sankey. Il diagramma Sankey mostra “valori attuali“ o “valori storici“. | |
| 7 | Tipo | Tipo di lettura (ad es. potenza attiva). | |
| 8 | Descrizione | Testo informativo inserito per un diagramma Sankey. | |
| 9 | Nome | Nome del diagramma Sankey. Facendo clic sul nome, si apre un’anteprima. | |
| 10 | Gruppo | Gruppo del diagramma Sankey. Configurabile nel configuratore Sankey. |
Il configuratore SankeyAnker sankeykonfigurator sankeykonfigurator
Utilizzare il configuratore Sankey per creare i propri diagrammi Sankey senza conoscenze di programmazione. Per disegnare un diagramma Sankey, creare i nodi e le connessioni in Sankey Configurator e collegarli tra loro come richiesto (cfr. anche con la descrizione “Nodi e connessioni“).
Il configuratore Sankey
- Si compone di 4 aree (Impostazioni, nodi, connessioni e anteprima).
- Consente di creare diagrammi Sankey individuali senza conoscenze di programmazione, creando e collegando nodi e connessioni.
- Serve ad esempio a creare analisi dei flussi energetici dell’azienda senza grandi sforzi. È anche possibile selezionare e visualizzare letture come corrente, potenza attiva o armoniche. Il prerequisito per le analisi dei flussi energetici sono gli strumenti di misura, ad esempio quelli dell’azienda Janitza. Questi ultimi devono essere inseriti nei punti di misura desiderati e collegati tramite il configuratore Sankey.
- Si apre per ogni diagramma Sankey facendo clic sul pulsante ““ nell’area “Azioni“ del Manager Sankey
(vedere la schermata “Il Manager Sankey“ nella Pos. 4).
Impostazioni
| Pos. | Icona | Testo breve | Descrizione |
|---|---|---|---|
| 1 | Nome del diagramma Sankey. | ||
| 2 | Salvataggio |
| |
| 3 | Nome |
| |
| 4 | Descrizione |
| |
| 5 | Gruppo |
| |
| 6 | Tipo | Un prerequisito per la creazione di un diagramma Sankey è la selezione del tipo di lettura.
| |
| 7 | Modalità colore | Selezione della modalità colore per le connessioni:
Con il pulsante di opzione “Transizione“ attivato, per le connessioni vengono utilizzati i colori dei nodi. | |
| 8 | Modalità tempo | Selezionare i valori in tempo reale o quelli storici:
| |
| 9 | Intervallo | Il configuratore Sankey richiede l’inserimento dell’intervallo di tempo in entrambe le modalità (valori in tempo reale e storici).
| |
| 10 | Lettura | Quando il cursore è attivato:
| |
| 11 | Valore relativo | Quando il cursore è attivato:
| |
| 12 | Modalità | Pulsante di opzione “Riferimento totale“ attivato:
Pulsante di opzione “Riferimento nodi“ attivato:
| |
| 13 | Valore di accompagnamento | Il valore di accompagnamento mostra il valore delle letture moltiplicato per un fattore e un’unità. In questo modo, i “costi“ (o simili) possono essere visualizzati in sintesi nelle connessioni del diagramma Sankey. Quando il cursore è attivato:
| |
| 14 | Fattore | Campo di immissione “Fattore“ Il fattore è l’operando che, moltiplicato per il valore delle letture e data l’unità appropriata (punto 15), dà il valore di accompagnamento. | |
| 15 | Unità | Campo di immissione “Unità“ Unità del valore di accompagnamento. | |
| 16 | Gestione perdite | Quando il cursore è attivato:
| |
| 17 | Tolleranza | Campo di immissione “Tolleranza“
| |
| 18 | Visualizzazione | L’elenco di selezione “Presentazione“ presenta 4 impostazioni:
L’impostazione selezionata viene visualizzata direttamente nella connessione del diagramma Sankey (vedere l’esempio “schermata tooltip“). | |
| 19 | Pulsante “Indietro“ | Facendo clic sul pulsante, si torna al Manager Sankey. | |
| 20 | Pulsante “Guida“ |
|
Esempio “Schermata Tooltip“:
Per questo esempio, sono attivati i seguenti cursori:
- Lettura (in kW)
- Valore relativo (in %)
- Valore di accompagnamento (in €)
L’impostazione dell’elenco di selezione “Rappresentazione“ è “Lettura“.
| Info | ||
|---|---|---|
| ||
Nell’installazione desktop di GridVis è possibile configurare Dispositivi virtuali (DV). Con i Dispositivi virtuali è possibile sommare diverse letture. Il risultato può essere selezionato come dispositivo indipendente. Questa applicazione è molto utile per sostituire una lettura mancante. |
Nodi e connessioni - SpiegazioneAnker gruppen_u_verbind gruppen_u_verbind
- Una connessione è un’area compresa tra due nodi
- Una connessione rappresenta una lettura come area.
- Un nodo non è una lettura.
- I nodi sono raggruppamenti o associazioni di connessioni (letture).
- I nodi possono avere più connessioni, ma anche una sola.
- I nodi hanno connessioni di ingresso e di uscita.
- I nodi iniziali hanno sempre solo connessioni di uscita.
- I nodi finali hanno sempre solo connessioni di ingresso.
| Configurazione | Funzione | Descrizione |
|---|---|---|
| Nodi |
| I nodi formati nel Configuratore Sankey possono essere definiti come nodi iniziali, intermedi o finali. I nodi hanno colori e nomi propri. |
| Connessioni |
| L’area di una connessione mostra il rapporto di grandezza (della lettura) rispetto all’intero piano. Una connessione viene utilizzata per collegare due nodi tra loro. |
![]() Nota:
Nota:
Per le letture mancanti per la creazione di un diagramma Sankey (ad esempio, le letture sono nel futuro o mancano registrazioni),
il sistema traccia le letture (connessioni) per il diagramma Sankey con linee rosse tratteggiate:
| Info | ||
|---|---|---|
| ||
Per la creazione di diagrammi Sankey complessi è importante e utile collegare i singoli nodi e visualizzare e controllare il risultato con la “funzione di anteprima“! |
Nodi
Un nodo
- non è una lettura!
- rappresenta una combinazione di letture.
- è necessario per stabilire la connessione.
Il sistema contrassegna i nodi inutilizzati. Nella finestra “Connessioni“ (sotto-navigazione > scheda “Connessioni“), collegare i nodi inutilizzati e il sistema rimuove il contrassegno.
| Info | ||
|---|---|---|
| ||
Strutturare i nodi creati in modo chiaro! Si consiglia di utilizzare i nodi creati nelle connessioni non appena vengono creati. |
| Pos. | Icona | Testo breve | Descrizione |
|---|---|---|---|
| 1 | Aggiungi nodo | Aggiungere un nuovo nodo. | |
| 2 |
| Salvare una configurazione | Salvare le impostazioni di configurazione del nodo. |
| 3 | Nome del nodo |
| |
| 4 | Scelta dei colori per i nodi |
| |
| 5 | Nodi iniziali | Tipo di nodo definito. Il tipo di nodo selezionato viene visualizzato in “blu“!
| |
| Nodi (nodi intermedi) | ||
| Nodi finali | |||
| 6 | Copia nodo | Facendo clic sul pulsante si copia il nodo selezionato. | |
| 7 |
| Posizione del nodo | Spostare il nodo creato verso l’alto o verso il basso nella finestra di configurazione.
|
| |||
| 8 | Cancella nodo |
|
Connessioni
- L’area di una connessione mostra il rapporto di grandezza (della lettura) rispetto all’intero piano.
- Una connessione viene utilizzata per collegare due nodi tra loro.
| Pos. | Icona | Testo breve | Descrizione |
|---|---|---|---|
| 1 | Aggiungi connessione | Aggiungere una nuova connessione. | |
| 2 | Salva connessione | Salvare le impostazioni di configurazione della connessione. | |
| 3 | Copia connessione | Facendo clic sul pulsante si copia la connessione selezionata. | |
| 4 | Posizione della connessione | Spostare le connessioni create verso l’alto o verso il basso nella finestra di configurazione.
| |
| 5 | Cancella connessione |
| |
| 6 | Nome della connessione | Appare nel diagramma Sankey come tooltip quando si sposta il mouse sulla connessione. | |
| 7 | Nodi iniziali | Mostra i tipi di nodo iniziale e intermedio.
| |
| 8 | Selezione dello strumento di misura | In assenza di strumenti di misura, è possibile utilizzare anche dispositivi virtuali (DV).
| |
| 9 | Selezione della lettura | Il tipo (di letture) selezionato nella finestra “Impostazioni“ (vedere Pos.6 “Il configuratore Sankey“) influenza la selezione. La selezione completa di tutte le letture è disponibile solo con il tipo (di lettura) “Personalizzato“. | |
| 10 | Nodi finali | Mostra i tipi di nodo finale e intermedio.
|
La funzione di anteprimaAnker anteprima anteprima
Facendo clic sul pulsante “Anteprima“ nella sottonavigazione si ottiene un’anteprima del diagramma Sankey.
Le connessioni appena create vengono visualizzate direttamente nella funzione “Anteprima“ del diagramma Sankey.
| Pos. | Icona | Testo breve | Descrizione |
|---|---|---|---|
| 1 | Indietro | Per tornare al manager Sankey | |
| 2 | Anteprima | Anteprima del diagramma Sankey |
![]() Nota:
Nota:
Per le letture mancanti per la creazione di un diagramma Sankey (ad esempio, le letture sono nel futuro o mancano registrazioni),
il sistema traccia le letture (connessioni) per il diagramma Sankey con linee rosse tratteggiate:
| Tipp |
|---|
I diagrammi Sankey che mostrano letture positive e negative tracciano
Se il diagramma Sankey contiene letture solo positive o solo negative, il sistema traccia completamente tutte le connessioni. Il segno “meno“ indica letture negative. |
Esempio 1: Letture positive e negative in un diagramma Sankey.
Esempio 2: Diagramma Sankey con letture esclusivamente negative.
Il widget SankeyAnker widget widget
I diagrammi Sankey creati possono essere inseriti come widget nelle dashboard già esistenti o in quelle nuove.
Nella finestra “Dasboard“, i diagrammi Sankey
- possono essere selezionati per nome.
- essere posizionati e scalati liberamente sulla dashboard.
| Pos. | Icona | Testo breve | Descrizione |
|---|---|---|---|
| 1 | Selezionare la visualizzazione | Elenco di selezione della visualizzazione: Selezionare il widget “Diagramma Sankey“! | |
| 2 | Scegliere un Sankey | Elenco di selezione di tutti i diagrammi Sankey | |
| 3 | Intestazione | Cursore per mostrare e nascondere l’intestazione. |
Gestione perdite
Il sistema calcola la perdita tra l’ingresso e l’uscita di un nodo. L’inserimento di una tolleranza (relativa in %) influenza la perdita. Le deviazioni delle letture che superano la tolleranza immessa vengono tracciate dal diagramma Sankey come perdita (i nodi interessati pulsano):
- Il colore delle “Perdite“ viene configurato tramite una finestra di dialogo nella finestra “Impostazioni“ (cfr. punto 16, tabella “Il configuratore Sankey“)
- Il sistema traccia le perdite come aree che confluiscono in un nodo di perdita.
- Un nodo di target di perditaè un’aggregazione di tutte le perdite subite.
Nel caso di un nodo pulsante, il gradiente di colore indica la direzione della perdita.
La perdita deriva da
(direzione della perdita):Gradiente di colore del nodo pulsante Annotazione Dall’ingresso all’uscita Da bianco a colore pieno (vedere Es.1 “Perdita all’uscita del nodo“). Dall’uscita all’ingresso Da colore pieno a bianco Le perdite sul lato d’ingresso del sistema non vengono tracciate come area
(vedere Es.2 “Perdita all’ingresso del nodo“).Tipp Le perdite che si verificano sul lato di ingresso sono per lo più errori di connessione o di configurazione.
Pertanto, la “Gestione perdite“ serve anche a verificare la plausibilità della configurazione.
Esempio 1 “Perdita all’uscita del nodo”
Esempio 2 “Perdita all’ingresso del nodo”