
| Sv translation | |||||||||||||||||||||||||||||||||||||||||||||||||||||||||||||||||||||||||||||||||||||||||||||||||
|---|---|---|---|---|---|---|---|---|---|---|---|---|---|---|---|---|---|---|---|---|---|---|---|---|---|---|---|---|---|---|---|---|---|---|---|---|---|---|---|---|---|---|---|---|---|---|---|---|---|---|---|---|---|---|---|---|---|---|---|---|---|---|---|---|---|---|---|---|---|---|---|---|---|---|---|---|---|---|---|---|---|---|---|---|---|---|---|---|---|---|---|---|---|---|---|---|---|
| |||||||||||||||||||||||||||||||||||||||||||||||||||||||||||||||||||||||||||||||||||||||||||||||||
> Die Graphfunktion> Die GraphanzeigeGültig für
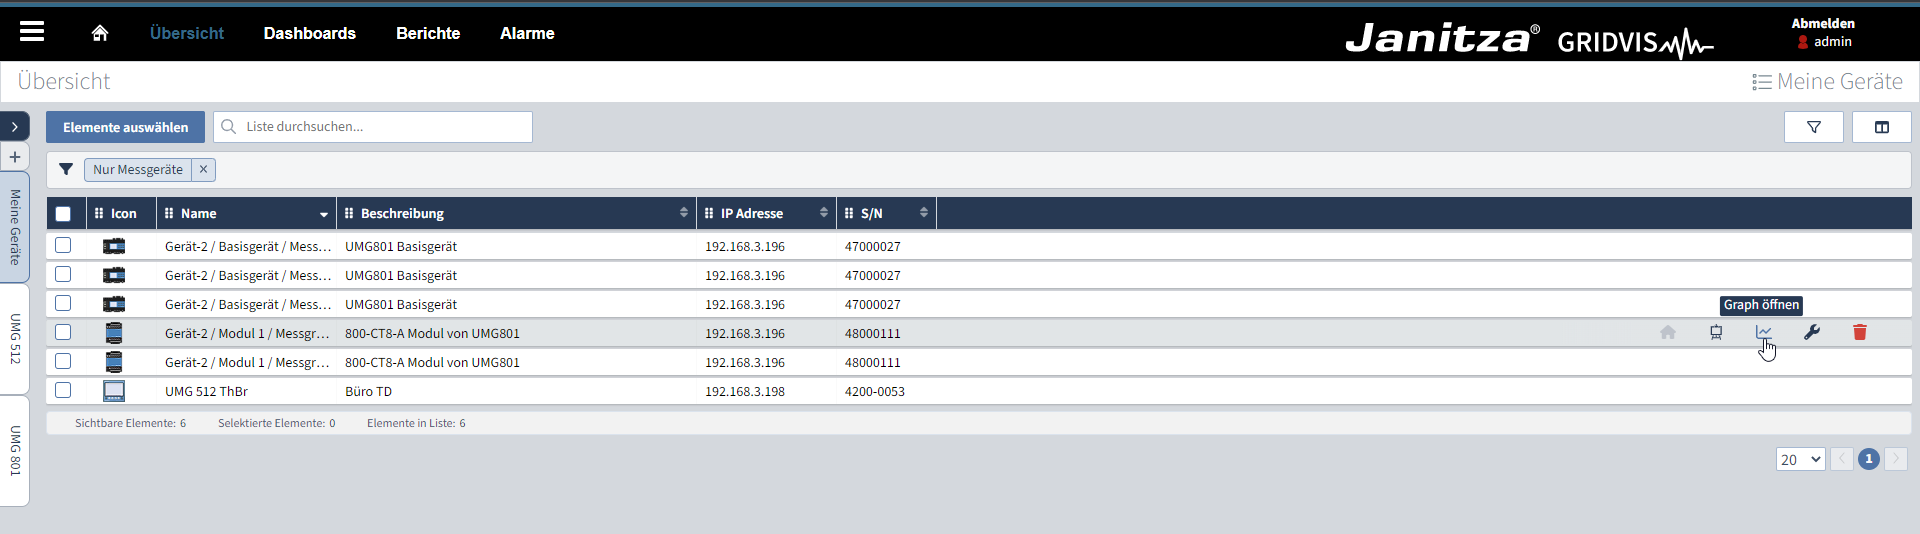
Mit der Graphfunktion zeigen Sie historische oder Livewerte ausgewählter Geräte an. Historische Werte sind Messwerte, die aus dem Gerät ausgelesen und in der Datenbank gespeichert wurden. Sie können in der Ansicht zwischen den Geräten wechseln und durch Anpinnen Messwerte verschiedener Geräte vergleichen. Fahren Sie mit der Maus über ein Gerät in der Geräteübersicht und klicken Sie auf das Graphsymbol (
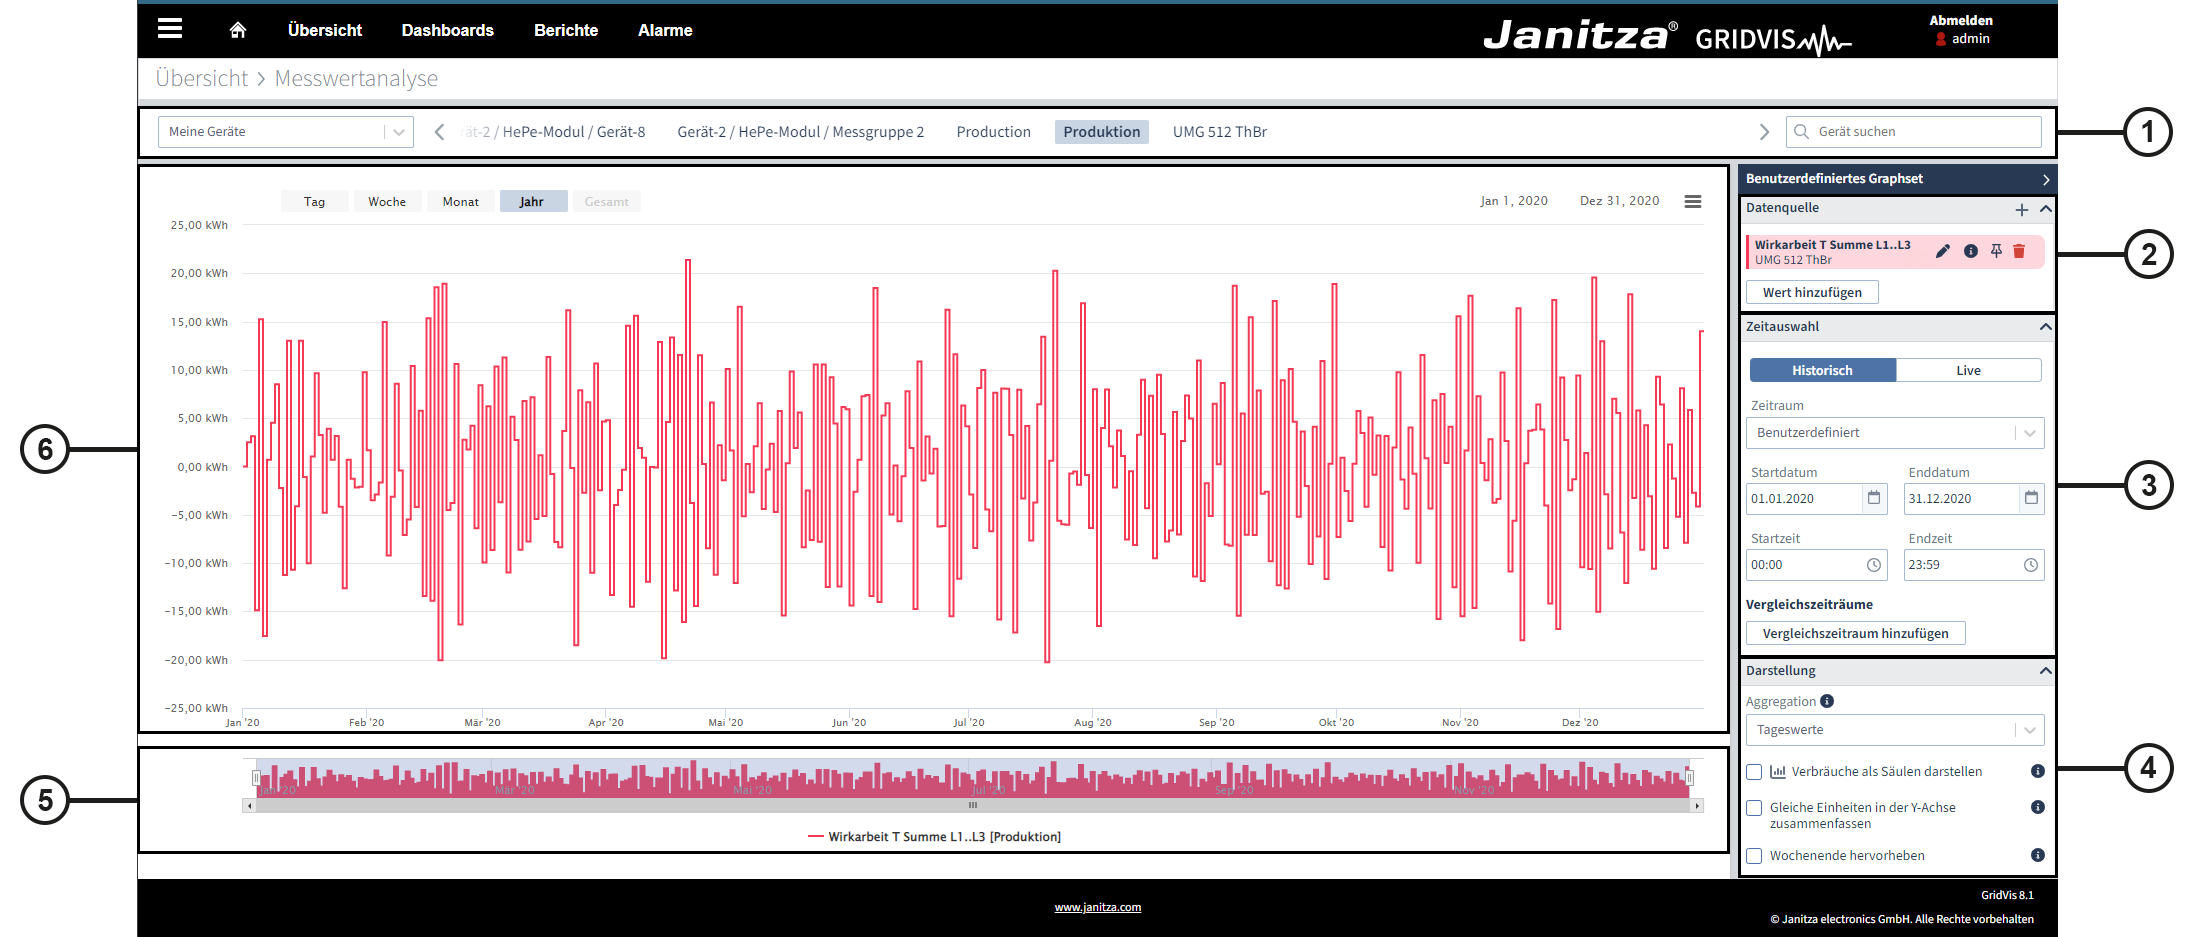
Treffen Sie die Einstellungen für den angezeigten Graphen.
|

| Sv translation | |||||||||||||||||||||||||||||||||||||||||||||||||||||||||||||||||||||||||||||||||||||||||||||||||
|---|---|---|---|---|---|---|---|---|---|---|---|---|---|---|---|---|---|---|---|---|---|---|---|---|---|---|---|---|---|---|---|---|---|---|---|---|---|---|---|---|---|---|---|---|---|---|---|---|---|---|---|---|---|---|---|---|---|---|---|---|---|---|---|---|---|---|---|---|---|---|---|---|---|---|---|---|---|---|---|---|---|---|---|---|---|---|---|---|---|---|---|---|---|---|---|---|---|
| |||||||||||||||||||||||||||||||||||||||||||||||||||||||||||||||||||||||||||||||||||||||||||||||||
> The Graph Function> The Graph DisplayValid for
The graph function allows you to display historical or live values for selected devices. Historical values are measurement values that have been read out of the device and stored in the database. In the graph display, you can switch between the devices and also compare the measurement values of different devices using pinning. Move the mouse over a device in the device overview and click on the graph icon (
Make the settings for the displayed graph.
|


| Sv translation | ||||||||||||||||||||||||||||||||||||||||||||||||||||||||||||||||||||||||||||||||||||||||||||||||||
|---|---|---|---|---|---|---|---|---|---|---|---|---|---|---|---|---|---|---|---|---|---|---|---|---|---|---|---|---|---|---|---|---|---|---|---|---|---|---|---|---|---|---|---|---|---|---|---|---|---|---|---|---|---|---|---|---|---|---|---|---|---|---|---|---|---|---|---|---|---|---|---|---|---|---|---|---|---|---|---|---|---|---|---|---|---|---|---|---|---|---|---|---|---|---|---|---|---|---|
| ||||||||||||||||||||||||||||||||||||||||||||||||||||||||||||||||||||||||||||||||||||||||||||||||||
> Función de gráficos> Pantalla de gráficosVálido para
La función de gráficos le permite visualizar valores históricos o valores en tiempo real de dispositivos seleccionados. Los valores históricos son aquellos valores de medición que se leyeron del dispositivo y se guardaron en la base de datos. En la vista usted puede cambiar entre los dispositivos y, mediante la función de anclaje, comparar los valores de medición de diferentes dispositivos. Para acceder a la función de gráficos, pase el ratón por encima de un dispositivo en la vista general de los dispositivos, y haga clic en el símbolo del gráfico (
Realice los ajustes para el gráfico mostrado.
|

| Sv translation | ||||||||||||||||||||||||||||||||||||||||||||||||||||||||||||||||||||||||||||||||||||||||||||||||||
|---|---|---|---|---|---|---|---|---|---|---|---|---|---|---|---|---|---|---|---|---|---|---|---|---|---|---|---|---|---|---|---|---|---|---|---|---|---|---|---|---|---|---|---|---|---|---|---|---|---|---|---|---|---|---|---|---|---|---|---|---|---|---|---|---|---|---|---|---|---|---|---|---|---|---|---|---|---|---|---|---|---|---|---|---|---|---|---|---|---|---|---|---|---|---|---|---|---|---|
| ||||||||||||||||||||||||||||||||||||||||||||||||||||||||||||||||||||||||||||||||||||||||||||||||||
> La funzione grafico> La visualizzazione del graficoValido per
Utilizzare la funzione grafico per visualizzare i valori storici o in tempo reale del dispositivo selezionato. I valori storici sono letture che sono state lette dal dispositivo e memorizzate nel database. È possibile passare da un dispositivo all’altro nella vista e confrontare le letture di diversi dispositivi tramite la funzione pin. Muovere il mouse su un dispositivo nella panoramica dei dispositivi e fare clic sul simbolo del grafico (
Configurare le impostazioni per il grafico visualizzato.
|