| Pos. | Parametro/Funzione | Descrizione |
|---|
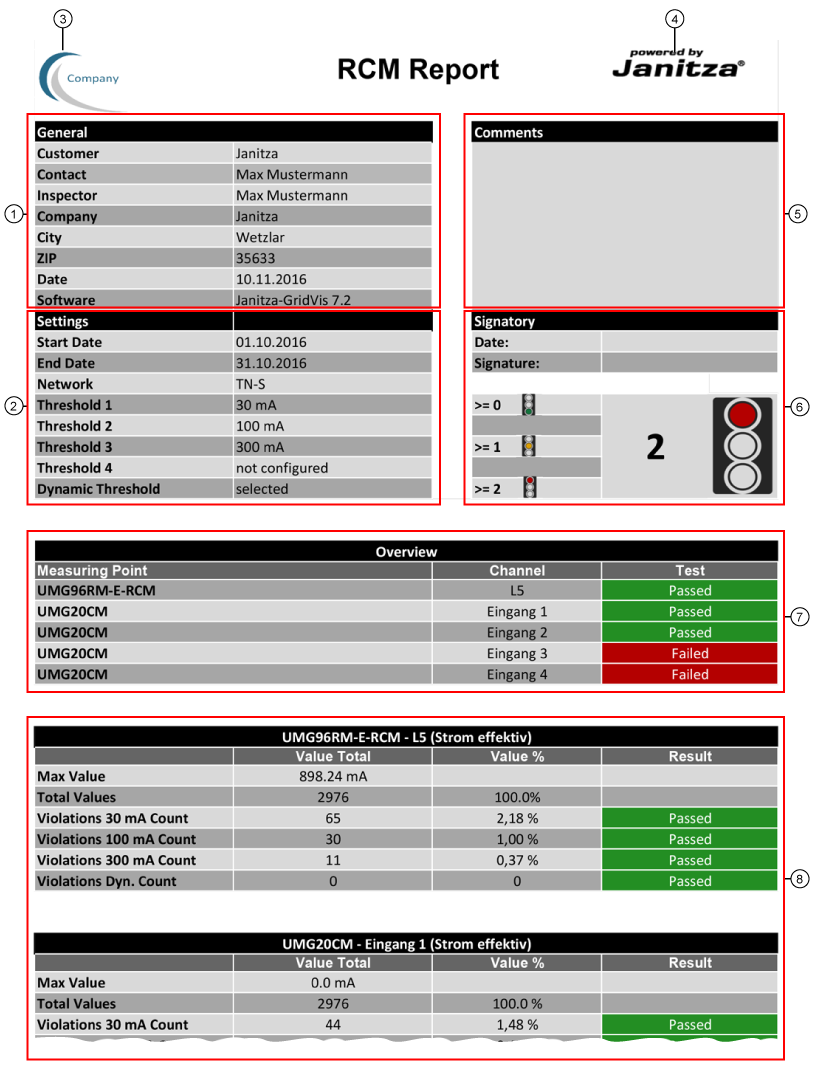
| 1 | General information (informazioni generali) | Inserimenti (cfr. passaggio “Etichettatura e design“ in Rapporto RCM): - Cliente, contatto, responsabile.
- Azienda, indirizzo (città, CAP).
- Data di creazione.
- Software, versione.
|
| 2 | Impostazioni | Registrazioni dei report RCM (cfr. passaggio “Seleziona intervallo“ e “Soglie“ in Rapporto RCM): - Inizio.
- Fine.
- Sistema di rete.
- Soglie 1 - 4.
- Soglia dinamica.
|
| 3 | Logo del cliente/dell’azienda | - Logo, ad es. “Cliente del report RCM“ (cfr. passaggio “Etichettatura e design“ in Rapporto RCM).
- Formati: tiff, gif, jpg e png.
|
| 4 | Logo | - Logo dell'organizzazione/azienda che esegue il report RCM (integrato nei modelli di design).
|
| 5 | Commento | - Campo commenti (cfr. passaggio “Etichettatura e design“ in Rapporto RCM).
|
| 6 | Area “Signatory”/Valutazione a semaforo | - Campi per la data e la firma
- A seconda del numero impostato di “misure con superamento di soglia“, il semaforo corrispondente viene visualizzato nel report RCM (vedere il passaggio “Valutazione“ in Rapporto RCM).
|
| 7 | Panoramica generale dei dispositivi/Valutazione totale | Mostra tutti i punti di misura (strumenti di misura) con lo stato di superamento di soglia per il rispettivo canale di misura: - verde - Test superato - punti di misura (misurazioni) entro le soglie.
- rosso - Test non superato - Punti di misurazione (misurazioni) con superamento di soglia.
|
| 8 | Panoramica dettagliata dei dispositivi | Mostra i punti di misura (strumenti di misura) con le letture e le informazioni: - Valore massimo.
- Numero totale di punti di misura (misurati nel periodo impostato - valore assoluto e relativo).
- Numero di superamenti di soglia (valore assoluto e relativo) della soglia dalla 1a alla 4a (a seconda dell'impostazione nel passaggio “Soglie“ in Rapporto RCM).
- Numero di superamenti di soglia (valore assoluto e relativo) del valore limite dinamico (cfr. passaggio “Soglie“ in Rapporto RCM).
|