
Neue Funktionen
| Kurztext | Komponente | Verfügbar in Edition | |
|---|---|---|---|
|
Verbesserte Listenfunktion und erweiterte HierarchieverwaltungUnsere überarbeitete Listenfunktion bringt zahlreiche Optimierungen mit sich. Dabei steht die Benutzerfreundlichkeit im Vordergrund. Die erweiterte Hierarchieverwaltung sticht besonders heraus: Sie ermöglicht es, erstellte Hierarchien für alle GridVis® Benutzer zugänglich zu machen und bietet zudem einen privaten Bereich für eine individuelle Gestaltungen mit einer eigenen Ordnerstruktur. | Geräteübersicht | Standard, Expert |
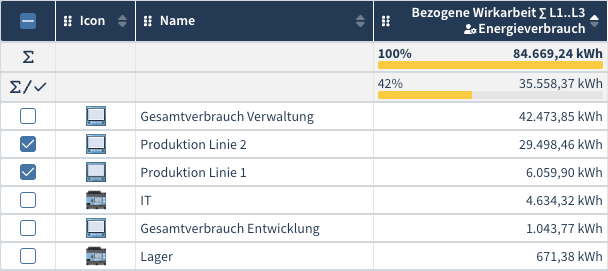
Aussagekräftige Verbrauchsanalyse: Summen in der Liste anzeigenWir haben die Verbrauchsanalyse in der Listenfunktion überarbeitet. Gewinnen Sie mühelos einen detaillierten Überblick über die Summen der Energieverbräuche in Ihrer Liste. Um zur Verbrauchsanalyse zu gelangen, fügen Sie einfach den gewünschten Energieverbrauch als separate Spalte hinzu und aktivieren Sie die Summenanzeige. Sie haben die Flexibilität, so viele Zeiträume in eine Liste einzufügen, wie Sie benötigen. Mit Hilfe der Selektionspalte können Sie eine “Was wäre, wenn”-Analyse betreiben. Ein starker einfacher Zugriff auf wichtige Energiedaten! | Geräteübersicht | Expert | |
|
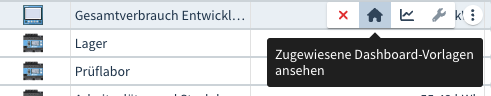
Dashboards direkt aus einer Liste in der Übersicht öffnenMit dem neuen Dashboard Editor ab GridVis®-Version 9.0 haben wir das Erstellen von Dashboards erleichtert. In der neuesten Version 9.1 bieten wir Ihnen zusätzlichen Komfort: Öffnen Sie in der Übersicht Dashboards direkt aus einer Liste. Weisen Sie einfach einer oder mehreren Zeilen Dashboards zu und betrachten Sie diese unmittelbar in der Übersicht, ohne in die Dashboardverwaltung zu wechseln. Dabei können Sie flink zwischen Dashboards wechseln und deren Zeitdarstellung nach Bedarf anpassen. Ein praktisches und benutzerfreundliches Update für Ihre schnelle und einfache Datenanalyse! | Geräteübersicht | Standard, Expert |
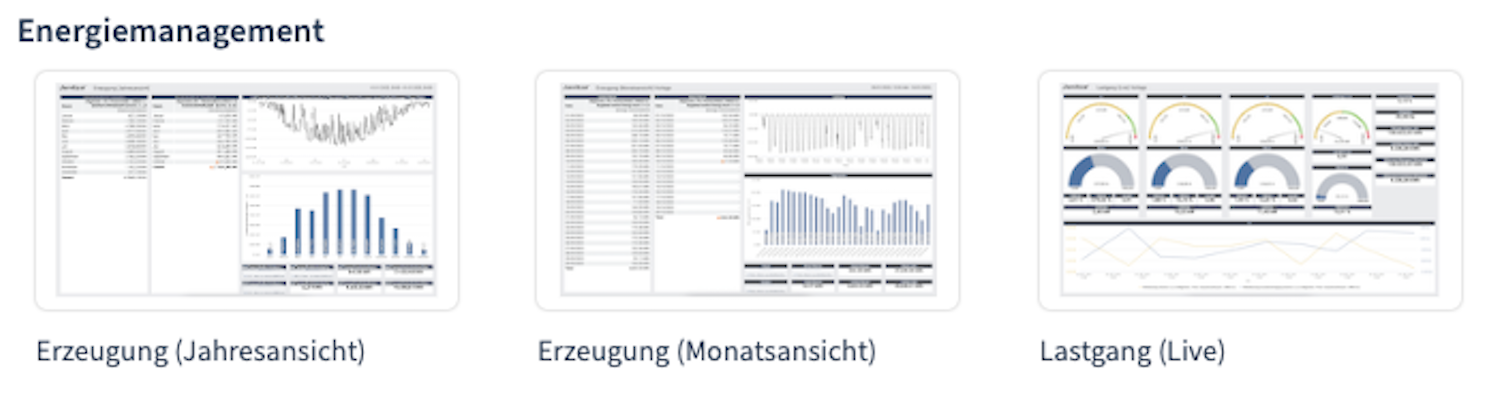
Vorgefertigte Vorlagen zum Erstellen von DashboardsMit unserem neuesten Release bieten wir Ihnen eine Auswahl an vorgefertigten Vorlagen, die den Prozess des Dashboard-Erstellens noch leichter machen. Nutzen Sie diese als Ausgangspunkt, passen Sie sie nach Ihren Wünschen an oder setzen Sie sie direkt in Ihren Projekten ein. Ein effektiver Weg, um Zeit zu sparen und produktiv zu sein. | Dashboards | Standard, Expert | |
|
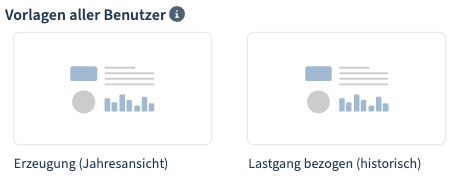
Gestalten Sie Ihre eigenen Dashboard-VorlagenAbseits der von uns bereitgestellten Vorlagen haben Sie jetzt die Möglichkeit, individuelle Dashboards als Vorlagen zu speichern. Dies kann in den Dashboardeinstellungen vorgenommen werden. So behalten Sie stets den Überblick und können Ihre Projekte noch schneller starten. | Dashboards | Standard, Expert |
Präzise Oberschwingungsanalyse: Das neue PQ-ObjektDas neue PQ-Objekt "Oberschwingungen (Säulendiagramm)" erweitert das Portfolio an Visualisierungsobjekten für Dashboards und Berichte in der GridVis®. Mit diesem Tool können historische harmonische Oberschwingungen effizient visualisiert werden. Das Objekt stellt diese als Säulendiagramm dar, wodurch eine klare und anschauliche Übersicht der wichtigen PQ-Daten gewährleistet wird. Dieses Objekt bildet eine sinnvolle Ergänzung zu den bestehenden PQ-Objekten und trägt dazu bei, die gemessenen Netzqualitätsparameter besser zu visualisieren. | Berichtseditor, Dashboards | Expert | |
|
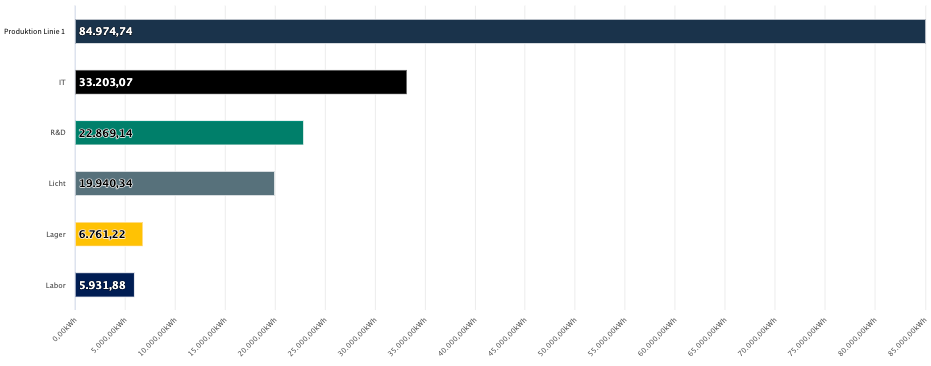
Neues Balkendiagramm zur schnellen ÜbersichtEine weitere Ergänzung im Bereich der Datenvisualisierung ist das neue Balkendiagramm, das Messwerte nun horizontal anzeigt. Im Unterschied zu herkömmlichen Säulendiagrammen ermöglicht diese horizontale Darstellung eine schnellere Erfassung der Daten, denn die dargestellten Werte werden absteigend sortiert. Es ist ideal für Anwendungen, bei denen es auf schnelle Einsicht und effektive Datenanalyse ankommt. Mit diesem Objekt können Anwender ihre Daten effizienter analysieren und informierte Entscheidungen schneller treffen. | Berichtseditor, Dashboards | Standard, Expert |
Die multiple lineare RegressionDank des neuen "Multiple lineare Regression"-Objekts können Sie nun noch tiefgreifendere Analysen durchführen. Mit diesem Werkzeug lässt sich beispielsweise der Energieverbrauch auf verschiedene Parameter untersuchen, um festzustellen, ob diese einen Einfluss auf den Energieverbrauch haben. Die ermittelten Abhängigkeiten werden übersichtlich in einer Tabelle dargestellt, sodass Sie stets den vollen Überblick behalten. | Berichtseditor, Dashboards | Expert | |
Modbus-Adresse vom Dashboard aus beschreibenMit unserem neuen "Modbus schreiben"-Objekt können Sie Parameter und Zustände direkt von Ihrem Dashboard aus in eine angegebene Modbus-Adresse schreiben. Das Besondere daran: Sie können damit nicht nur Messgeräte direkt parametrisieren, sondern auch Fehlerstrom-Grenzwerte dynamisch anpassen oder sogar digitale Ausgänge schalten. All dies direkt von Ihrem Dashboard aus, was Ihnen eine gute Ergänzung in der Anlagensteuerung und -überwachung bietet. Dies kann entweder durch ein manuelles Eingabefeld oder mit vordefinierten Buttons erfolgen. Ein Klick auf einen solchen Button überträgt automatisch den festgelegten Wert. Dies eröffnet eine Vielzahl von Anwendungen, die zuvor so noch nicht realisierbar waren. | Dashboards | Expert | |
Erweiterter Spannungsqualitätsreport nach IEEE 519Der Spannungsqualitätsreport in der GridVis® wurde gemäß der aktuellen Norm IEEE 519 - 2022 aktualisiert. Dieser Datenexport, konfigurierbar in der GridVis®-Desktop, ermöglicht wie gewohnt auch eine Auswertung über das Web. Ein Merkmal dieses Reports ist die Möglichkeit, die Strom- und Spannungsanalyse unabhängig voneinander zu generieren, je nach Bedarf. Durch die Anpassung an die IEEE 519 - 2022 Norm gewährleistet der Datenexport eine konsistente und standardisierte Bewertung der Spannungsqualität, was eine optimale Überwachung und Steuerung Ihrer Anlagen unterstützt. | Datenexporte | Standard, Expert | |
| Optimierte Navigationsfunktion im LiniendiagrammUnsere Liniendiagramme auf den Dashboards bieten jetzt eine verbesserte Navigation durch die Einführung des "Navigators". Diese Funktion, die in den Einstellungen aktiviert werden kann, ermöglicht es Ihnen, im Präsentationsmodus Ihres Dashboards intuitiv durch Zeitabschnitte zu navigieren. Vergrößern und verkleinern Sie beliebige Abschnitte, um tiefer in Ihre Messdaten einzutauchen und wichtige Details hervorzuheben. Diese neue Funktion erleichtert das Erkennen von Mustern und Abweichungen in Ihren Daten und unterstützt eine effiziente Analyse. | Dashboards | Standard, Expert |
Erweiterte Linkfunktion für effiziente Dashboard-NutzungDie Linkfunktion in unseren Dashboards wurde erweitert. Jedem Link kann ein spezifisches Gerät zugeordnet werden, dessen Daten beim Öffnen des Dashboards dargestellt werden. Diese Funktionalität eröffnet die Möglichkeit, direkt über einen Link aus einer Gesamtübersicht verschiedener Geräte in eine detaillierte Ansicht für ein ausgewähltes Messgerät zu wechseln. So können Sie mit wenig Aufwand ein Dashboard erstellen das immer wieder typische Messdaten eines Messgeräts darstellt. | Dashboards | Standard, Expert |


Optimierungen und Fehlerkorrekturen (Changelog)
| Kurztext | Komponente | Betrifft | Version | |
|---|---|---|---|---|
| Funktionserweiterung Dashboardeditor: Neues Objekt "Modbus schreiben" | Dashboards | GridVis®-Web | 9.1.0 |
| Sicherheitsupdate für CVE-2023-50895: In GridVis®-Versionen kleiner als 9.0.67 konnte ein benutzerkontrolliertes speziell platziertes Groovy-Script authentifizierte Codeausführung ermöglichen. | GridVis® | GridVis®-Desktop / GridVis®-Web | 9.1.0 |
| Sicherheitsupdate für CVE-2023-50894: In GridVis®-Versionen kleiner als 9.0.67 wurden mit einem fest codierten Passwort verschlüsselte Zugangsdaten zu verbundenen Datenbanksystemen über eine als angemeldeter Benutzer erreichbaren Fehlerberichtsfunktion ausgegeben, was effektiv einer Preisgabe im Klartext entsprach. | GridVis® | GridVis®-Desktop / GridVis®-Web | 9.1.0 |
| Fehlerkorrektur MSCONS-Export: Gerätenummernherkunft und Dateispeicherort werden gespeichert | Daten-Exporte / Reporte | GridVis®-Desktop | 9.1.0 | |
| Fehlerkorrektur Dashboards: Es wurde ein Fehler behoben, bei dem keine Dashboards erstellt werden konnten, wenn ein Dashboard einem Benutzer zugewiesen wurde | Dashboards | GridVis®-Web | 9.1.0 |
| Fehlerkorrektur Dashboards: Im Textobjekt wurde ein Problem bei der Darstellung behoben | Dashboards | GridVis®-Web | 9.1.0 | |
| Funktionserweiterung Dashboards & Berichte: Es wurde ein neues Objekt "Balkendiagramm" hinzugefügt | Berichtseditor / Dashboards | GridVis®-Web | 9.1.0 |
| Fehlerkorrektur MSCONS-Export: Zählerstand-Export wieder möglich | Daten-Exporte / Reporte | GridVis®-Desktop | 9.1.0 | |
| Fehlerkorrektur OPC UA: Verbindungsstabilität | OPC | GridVis®-Desktop / GridVis®-Web | 9.1.0 |
| Fehlerkorrektur UMG 806: Historische Daten konnten konnten seit GridVis®-Version 9.0.63 fehlerhaft sein | Geräte | GridVis®-Desktop / GridVis®-Web | 9.1.0 | |
| Fehlerkorrektur Zeitverwaltung: Es wurde ein Fehler in der Zeitverwaltung bei der Verwendung von Tarifen behoben | Zeitmanagement | GridVis®-Desktop | 9.1.0 | |
| Funktionserweiterung UMG 806-LP: Geräteunterstützung UMG 806-LP | Geräte | GridVis®-Desktop / GridVis®-Web | 9.1.0 |
| Funktionserweiterung Dashboards & Berichte: Es steht ein Objekt zur graphischen Darstellung von Oberschwingungen zur Verfügung | Berichtseditor / Dashboards | GridVis®-Web | 9.1.0 | |
| Funktionsänderung Hierarchie: Es ist nur noch möglich Hierarchien bis zu einer Ordnertiefe von maximal 10 anzulegen | Geräteübersicht | GridVis®-Web | 9.1.0 |
| Funktionsänderung Dashboards & Berichte: Das Laden von historischen Werten auf Dashboards & Berichten wurde beschleunigt | Berichtseditor / Dashboards | GridVis®-Web | 9.1.0 | |
| Funktionsänderung ZSG: Aufgrund der Abschaffung der EEG Umlage können keine neuen ZSG Datenexporte erstellt werden | Daten-Exporte / Reporte | GridVis®-Desktop | 9.1.0 |
| Fehlerkorrektur UMG 806: Relais Ausgang Konfiguration | Geräte | GridVis®-Desktop / GridVis®-Web | 9.1.0 | |
| Sicherheitsupdate SQL: Aktualisierung der SQL Treiber | GridVis® | GridVis®-Desktop / GridVis®-Web | 9.1.0 |
| Fehlerkorrektur OPC UA: Verbindungsstabilität | OPC | GridVis®-Desktop / GridVis®-Web | 9.1.0 |
| Funktionserweiterung UMG 806: Verbindungseinstellung Easy Gateway | Geräte | GridVis®-Desktop / GridVis®-Web | 9.1.0 | |
| Funktionserweiterung UMG 806: Schleppzeiger werden unterstützt | Geräte | GridVis®-Desktop / GridVis®-Web | 9.1.0 |
| Funktionserweiterung Listenfunktion: Neben den bekannten Relationsbalken können Anteilsbalken zur besseren Darstellung von Energiewerten angezeigt werden | Geräteübersicht | GridVis®-Web | 9.1.0 | |
| Funktionsänderung Listenfunktion: Die Verbrauchsanalyse ist übersichtlicher und kann im oberen Bereich jeder Liste eingeblendet werden | Geräteübersicht | GridVis®-Web | 9.1.0 |
| Funktionserweiterung Hierarchie: Es können private und die öffentliche Hierarchien gepflegt werden und die Strukturen zwischen den beiden Hierarchien verschoben und kopiert werden. Jede Hierarchie kann auch separat bearbeitet werden | Geräteübersicht | GridVis®-Web | 9.1.0 | |
| Fehlerkorrektur Benutzerverwaltung: Herunterladen von Fehlerberichten bei Verwendung von Active Directory behoben | Active Directory | GridVis®-Desktop | 9.1.0 |
| Fehlerkorrektur Datenbankaktion: Beim Gerätetausch mit bestimmten Geräten kam es zu einem Fehler | Datenbank | GridVis®-Desktop / GridVis®-Web | 9.1.0 | |
| Funktionserweiterung Event Browser: In der Geräteauswahl kann nach den Listen der neuen Listenfunktion gefiltert werden | Daten-Exporte / Reporte | GridVis®-Desktop | 9.1.0 |
| Fehlerkorrektur RCM 202-AB: Es wurde ein Fehler behoben, bei dem im Dialog "Konfiguration an mehrere Geräte übertragen" das Kästchen für "Prüfzeitintervall, um die RCM Prüffunktionen zu konfigurieren" nicht aufgetaucht ist | Geräte | GridVis®-Desktop / GridVis®-Web | 9.1.0 | |
| Funktionserweiterung GridVis®: Italienisch wird als neue Standardsprache in der GridVis® unterstützt | GridVis® | GridVis®-Desktop / GridVis®-Web | 9.1.0 |
| Funktionserweiterung Dashboards: Es stehen Janitza® Dashboard-Vorlagen bei der Erstellung neuer Dashboards zur Verfügung | Dashboards | GridVis®-Web | 9.1.0 | |
| Funktionserweiterung Dashboards: Für das Objekt Gerätename kann optional ein Gerät ausgewählt werden, dessen Name dargestellt wird | Dashboards | GridVis®-Web | 9.1.0 |
| Fehlerkorrektur Berichtseditor: Beim Hinzufügen bestimmter Messwerte kam es zu einem Fehler | Berichtseditor | GridVis®-Web | 9.1.0 | |
| Fehlerkorrektur Benutzerverwaltung: Es wurde ein Fehler im Rechtesystem im Zusammenhang mit den Berichten im Web korrigiert | Benutzerverwaltung | GridVis®-Web | 9.1.0 |
| Funktionserweiterung UMG 96-S2: Webkonfiguration | Geräte | GridVis®-Desktop / GridVis®-Web | 9.1.0 | |
| Funktionserweiterung Dashboards & Berichte: Im numerischen Wert kann ein Grenzwert definiert werden | Berichtseditor / Dashboards | GridVis®-Web | 9.1.0 |
| Funktionserweiterung Dashboard: Tabellen zeigen einen Hinweis, wenn die Datenqualität für den betrachteten Zeitraum zu gering ist | Dashboards | GridVis®-Web | 9.1.0 |
| Funktionserweiterung UMG 96-PQ-L: Erleichterung der Netzkonfiguration | Geräte | GridVis®-Desktop / GridVis®-Web | 9.1.0 | |
| Funktionserweiterung UMG 103-CBM: Webkonfiguration | Geräte | GridVis®-Desktop / GridVis®-Web | 9.1.0 |
| Funktionserweiterung OPC UA Client: Möglichkeit der Erstellung von Subgruppen in der Tagliste zur besseren Übersicht | OPC | GridVis®-Desktop / GridVis®-Web | 9.1.0 | |
| Funktionserweiterung Dashboards: Einer Verlinkung zu einem Dashboard kann ein Gerät übergeben werden, mit dem das Dashboard geöffnet werden soll | Dashboards | GridVis®-Web | 9.1.0 |
| Funktionserweiterung Dashboards: Im Liniendiagramm steht eine Navigationsleiste zur Verfügung, um einen Datenausschnitt zu vergrößern | Dashboards | GridVis®-Web | 9.1.0 |
| Funktionserweiterung OPC UA Client: Ex- und Importfunktion | OPC | GridVis®-Desktop / GridVis®-Web | 9.1.0 | |
| Funktionserweiterung Dashboards: Es steht ein Objekt zur Regressionsberechnung mit mehreren Einflussfaktoren zur Verfügung | Dashboards | GridVis®-Web | 9.1.0 |
Technische Änderungen vorbehalten.
Die Inhalte, Leistungsmerkmale und Diagramme der Software-Beschreibung entsprechen nicht immer den konkreten Anwendungsfällen und ändern sich, z.B. bei Weiterentwicklungen der Software. Die Inhalte wurden mit größter Sorgfalt zusammengestellt und entsprechen unserem derzeitigen Informationsstand. Fehler können nicht ausgeschlossen werden.
Gewünschte Leistungsmerkmale und Lieferbedingungen sind nur verbindlich, wenn sie bei Vertragsabschluss ausdrücklich vereinbart werden.
Wiedergegebene Gebrauchsnamen, Handelsnamen und Bezeichnungen obliegen den Richtlinien des Herstellers. Die Janitza electronics GmbH übernimmt keine Verpflichtung, diese Software-Beschreibung auf dem neuesten Stand zu halten. Weitere aktuelle Informationen und Spezifikationen finden Sie auf www.janitza.de.