
| Sv translation | |||||||||||||||||||||||||||||||||||||||||||||
|---|---|---|---|---|---|---|---|---|---|---|---|---|---|---|---|---|---|---|---|---|---|---|---|---|---|---|---|---|---|---|---|---|---|---|---|---|---|---|---|---|---|---|---|---|---|
| |||||||||||||||||||||||||||||||||||||||||||||
AnwendungsbeispielIn diesem Anwendungsbeispiel wird eine Berichtsseite erstellt, auf der die bezogene Wirkarbeit des vergangenen Jahres von drei Unternehmensbereichen dargestellt ist. Der Bericht enthält zudem eine globale Kopf- und Fußzeile.
Anker |
|
| Anker | ||||
|---|---|---|---|---|
|
- Legen Sie einen neuen Bericht an und benennen Sie ihn.
- Stellen Sie als Berichtszeitraum Letztes Jahr ein.
- Stellen Sie als Seitenformat Querformat A4 ein.
| Tipp | ||
|---|---|---|
| ||
|
Anker KopfFuss KopfFuss
Kopf- und Fußzeile
| KopfFuss | |
| KopfFuss |
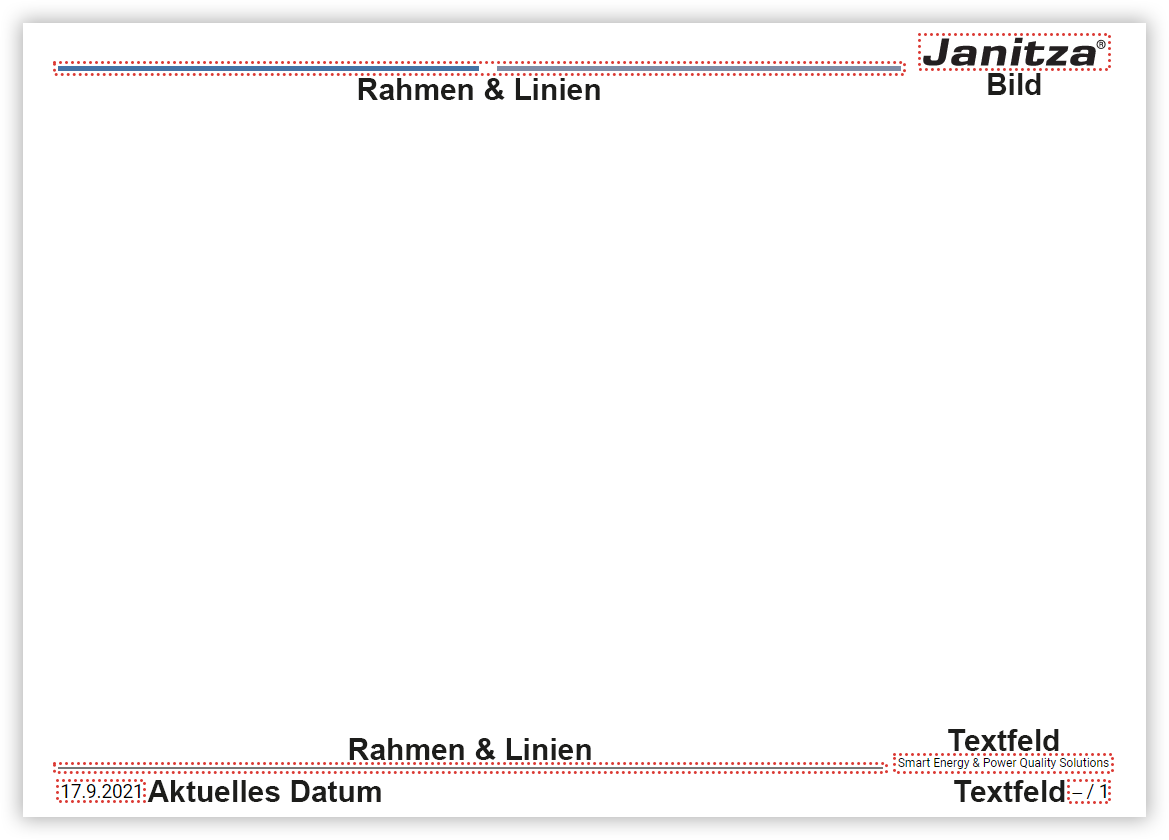
Die Kopf- bzw. Fußzeile wird auf der Masterseite zusammengestellt. Klicken Sie im Berichtsnavigator auf die Masterseite, um Objekte hinzuzufügen und zu bearbeiten.
Kopfzeile
- Setzen Sie farbige Akzente mit dem Objekt Rahmen & Linien. Für jede Farbe benötigen Sie ein separates Objekt.
Aktivieren Sie nur den unteren Objektrand, um eine einfache Linie anzuzeigen.
Verwenden Sie die Objekthöhe, um den Abstand zum oberen Seitenrand festzulegen. Platzieren Sie Ihr Firmenlogo mit dem Bildobjekt.
Fußzeile
- Grenzen Sie die Fußzeile mit einer Linie ab.
Aktivieren Sie im Objekt Rahmen & Linien nur den oberen Objektrand, um eine einfache Linie anzuzeigen.
Verwenden Sie die Objekthöhe, um den Abstand zum unteren Seitenrand festzulegen. - Platzieren Sie Ihren Unternehmensclaim mit einem Textfeld auf der rechten Seite der Fußzeile.
Setzen Sie den Text rechtsbündig. - Platzieren Sie das Datum in der linken unteren Ecke mit dem Objekt Aktuelles Datum.
- Platzieren Sie die Seitenzahl mit der Gesamtseitenzahl in einem Textobjekt in der rechten unteren Ecke.
Setzen Sie den Text rechtsbündig.
Verwenden Sie die Codes der dynamischen Inhalte und geben Sie ##page / ##pageTotal ein.
| Tipp | ||
|---|---|---|
| ||
|
| Anker | ||||
|---|---|---|---|---|
|
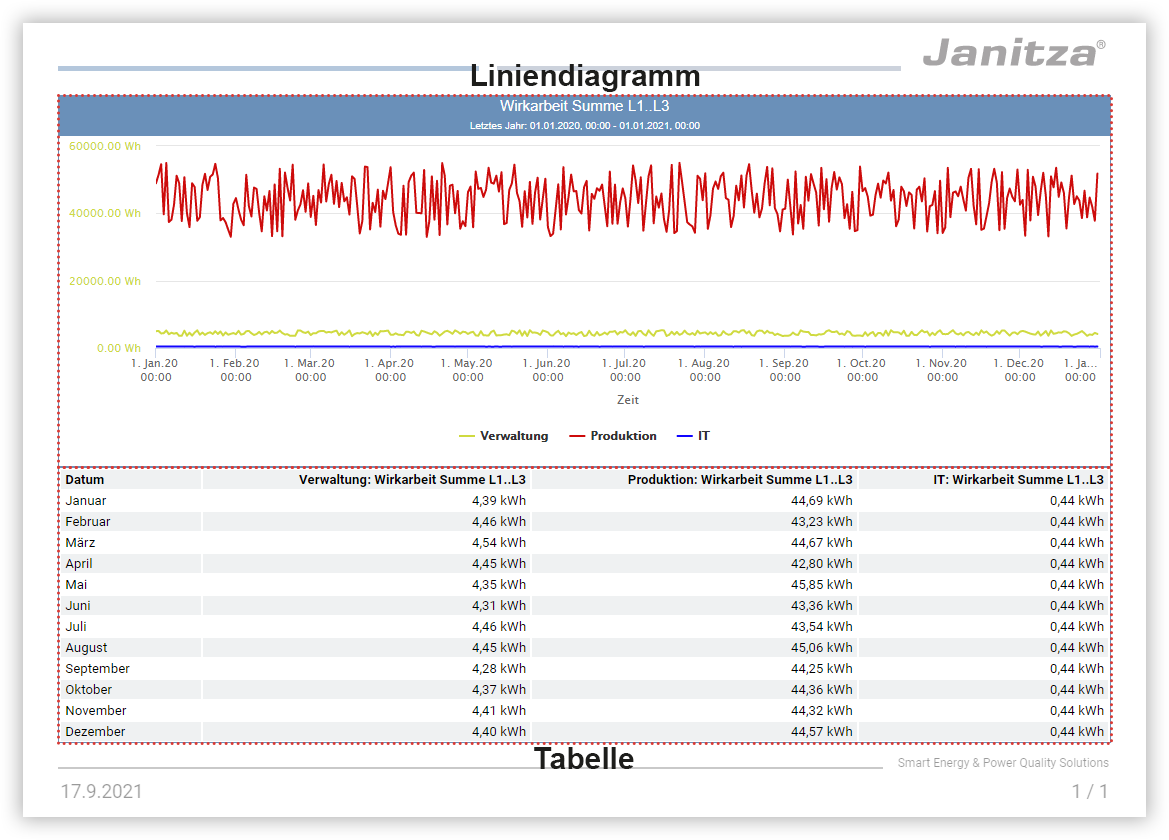
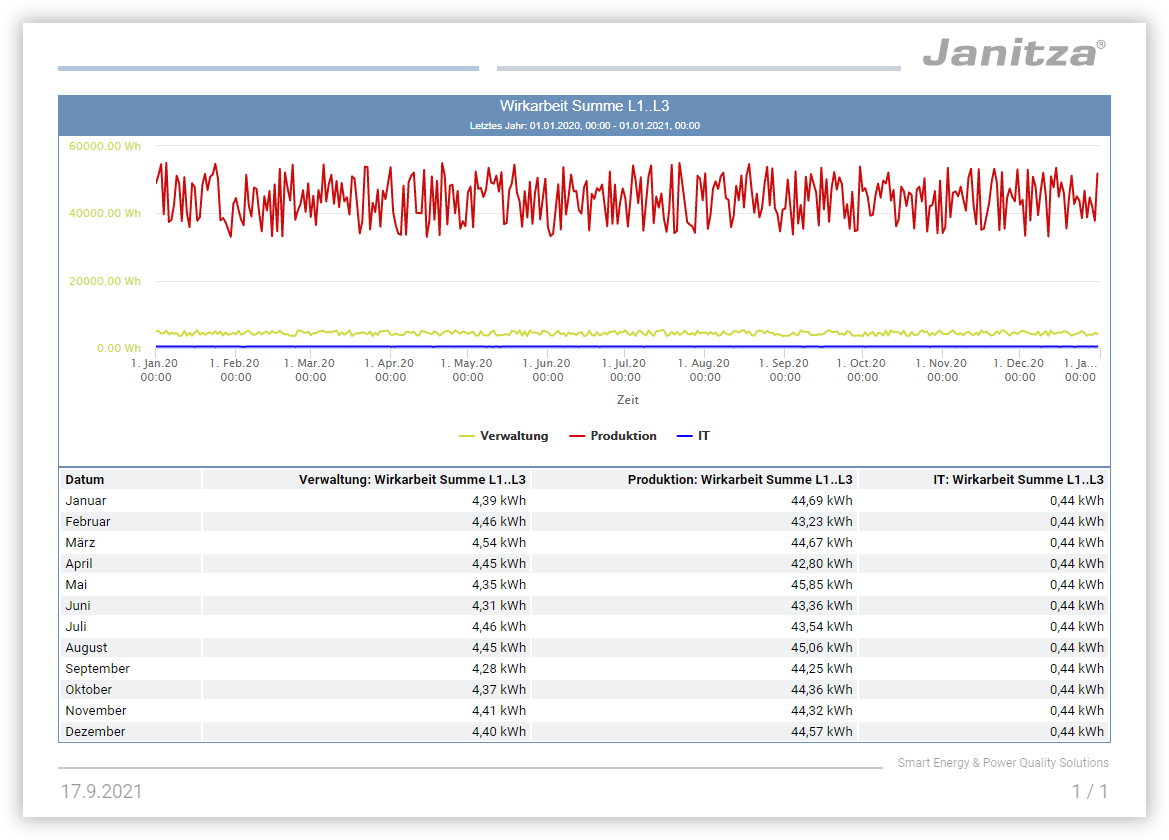
Wechseln Sie zu der Berichtsseite, um die Datenobjekte hinzuzufügen und zu bearbeiten.
Die Wirkarbeit wird in der oberen Seitenhälfte als Verlauf über den Berichtszeitraum dargestellt. In der unteren Seitenhälfte werden die Monatswerte als Tabelle angegeben.
- Platzieren Sie ein Liniendiagramm auf der oberen Seitenhälfte. Ordnen Sie es so an, dass es die gewünschte Seitenbreite ausfüllt.
- Aktivieren Sie die Anzeige der Titel- und Statuszeile und des Rahmens.
Tragen Sie als Objektname den Messwertnamen ein, um ihn als Überschrift des Diagramms zu verwenden. - Wählen Sie die anzuzeigenden Messwerte aus.
Konfigurieren Sie die Messwerte. Vergeben Sie Anzeigenamen und unterschiedliche Farben und verwenden Sie als Zeichenmethode gerade.
Klicken Sie auf Speichern, um die Messwerte dem Diagramm hinzuzufügen. - Aktivieren Sie die Anzeige der Legende.
- Überprüfen Sie den Abstand zur Kopfzeile.
- Platzieren Sie eine Tabelle auf der unteren Seitenhälfte. Ordnen Sie sie so an, dass sie die gewünschte Seitenbreite ausfüllt.
- Aktivieren Sie nur die Anzeige des Rahmens.
- Stellen Sie in den Texteigenschaften rechtsbündige Textausrichtung und alternierende Zeilen ein.
- Wählen Sie die anzuzeigenden Messwerte aus.
Konfigurieren Sie die Messwerte. Lassen Sie den Anzeigenamen frei, damit automatisch der Gerät- und Messwertname verwendet wird.
Klicken Sie auf Speichern, um die Messwerte der Tabelle hinzuzufügen. - Stellen Sie als Aggregation Monat ein.
- Überprüfen Sie den Abstand zur Fußzeile.
| Tipp | ||
|---|---|---|
| ||
|
| Anker | ||||
|---|---|---|---|---|
|
Die Objekte sind vollständig konfiguriert. Vergleichen Sie Ihre Seite mit dem Beispiel.
| Sv translation | |||||||||||||||||||||||||||||||||||||||||||||
|---|---|---|---|---|---|---|---|---|---|---|---|---|---|---|---|---|---|---|---|---|---|---|---|---|---|---|---|---|---|---|---|---|---|---|---|---|---|---|---|---|---|---|---|---|---|
| |||||||||||||||||||||||||||||||||||||||||||||
Application ExampleIn this application example, a report page is created showing the applied active energy of the past year for three areas of the company. The report also includes a global header and footer.
Anker |
|
| Anker | ||||
|---|---|---|---|---|
|
- Create a new report and name it.
- Set the report period to Last year .
- Set the page format to Landscape A4 .
| Tipp | ||
|---|---|---|
| ||
|
Anker KopfFuss KopfFuss
Header and Footer
| KopfFuss | |
| KopfFuss |
Arrange the header or footer on the master page. In the report navigator, click Master Page, to add and edit objects.
Header
- Set colorful accents with the object Borders & Lines. You need a separate object for each color.
Activate only the bottom edge of the object to display a simple line.
Use the object height to set the distance to the top of the page. Place your company logo using the image object.
Footer
- Delimit the footer with a line.
In the object Borders & Lines , activate only the top edge of the object to display a simple line.
Use the object height to set the distance to the bottom of the page. - Place your company claim using a text box on the right side of the footer.
Set the text alignment to right justified. - Place the date in the lower left corner using the object Current Date.
- Place the page number with the total number of pages in a text object in the lower right corner.
Set the text alignment to right justified.
Use the codes of the dynamic content and enter ##page / ##pageTotal .
| Tipp | ||
|---|---|---|
| ||
|

| Anker | ||||
|---|---|---|---|---|
|
Go to the Report Page, to add and edit the data objects.
The active energy is shown in the upper half of the page as a progression over the report period. The lower half of the page gives the monthly values as a table.
- Place a line chart on the top half of the page. Arrange it so that it fills the desired page width.
- Activate the display of the title and status bar and the frame.
Enter the measurement value name as the object name to use it as the heading of the chart. - Select the measurement values to be displayed.
Configure the measurement values. Assign display names and different colors and use Straight as the drawing method.
Click Save, to add the measurement values to the chart. - Activate display of the legend.
- Check the distance to the header.
- Place a table on the bottom half of the page. Arrange it so that it fills the desired page width.
- Activate only the display of the frame.
- In the text properties, set right-justified text alignment and alternating lines.
- Select the measurement values to be displayed.
Configure the measurement values. Leave the display name blank so that the device and measurement value name is used automatically.
Click Save, to add the measurement values to the table. - As the aggregation, set Month .
- Check the distance to the footer.
| Tipp | ||
|---|---|---|
| ||
|

| Anker | ||||
|---|---|---|---|---|
|
The objects are fully configured. Compare your page with the example.

| Sv translation | |||||||||||||||||||||||||||||||||||||||||||||
|---|---|---|---|---|---|---|---|---|---|---|---|---|---|---|---|---|---|---|---|---|---|---|---|---|---|---|---|---|---|---|---|---|---|---|---|---|---|---|---|---|---|---|---|---|---|
| |||||||||||||||||||||||||||||||||||||||||||||
Ejemplo de aplicaciónEn este ejemplo de aplicación se crea una página de informe en la que se representa la energía activa consumida del pasado año de tres áreas empresariales. Además, el informe contiene un encabezado y un pie de página globales.
Anker |
|
| Anker | ||||
|---|---|---|---|---|
|
- Cree un nuevo informe y asígnele un nombre.
- Como periodo de tiempo del informe, ajuste Último año .
- Como formato de página, ajuste Formato horizontal A4 .
| Tipp | ||
|---|---|---|
| ||
|
Anker KopfFuss KopfFuss
Encabezado y pie de página
| KopfFuss | |
| KopfFuss |
El encabezado y el pie de página se componen en la página maestra. En el navegador de informe, haga clic en la Página maestra para agregar o editar objetos.
Encabezado
- Cree acentos de color con el objeto Marcos y líneas. Usted necesita un objeto separado para cada color.
Active únicamente el borde inferior del objeto para mostrar una línea sencilla.
Utilice la altura del objeto para establecer la distancia del margen superior de la página. Coloque su logo corporativo con el objeto de imagen.
Pie de página
- Delimite el pie de página con una línea.
Active en el objeto Marcos y líneas únicamente el borde superior del objeto para mostrar una línea sencilla.
Utilice la altura del objeto para establecer la distancia del margen inferior de la página. - Coloque su eslogan corporativo con un campo de texto en la parte derecha del pie de página.
Alinee el texto a la derecha. - Coloque la fecha en la esquina inferior izquierda con el objeto Fecha actual.
- Coloque el número de página con la cantidad total de páginas en un objeto de texto en la esquina inferior derecha.
Alinee el texto a la derecha.
Utilice los códigos de los contenidos dinámicos e introduzca ##page / ##pageTotal .
| Tipp | ||
|---|---|---|
| ||
|
| Anker | ||||
|---|---|---|---|---|
|
Cambie a la página del informe, para agregar y editar los objetos de datos.
La energía activa se representa en la mitad superior de la página como desarrollo a lo largo del periodo de tiempo del informe. En la mitad inferior de la página se indican los valores mensuales como tabla.
- Coloque un gráfico lineal en la mitad superior de la página. Dispóngalo de tal manera que llene el ancho deseado de la página.
- Active la visualización de la barra de título y de la línea de estado y del marco.
Introduzca el nombre del valor de medición como nombre de objeto para utilizarse como título del gráfico. - Seleccione los valores de medición que deban mostrarse.
Configure los valores de medición. Asigne nombres de visualización y diferentes colores, y utilice como método de dibujo recta.
Haga clic en Guardar, para agregar los valores de medición al gráfico. - Active la visualización de la leyenda.
- Compruebe la distancia del encabezado.
- Coloque una tabla en la mitad inferior de la página. Dispóngala de tal manera que llene el ancho deseado de la página.
- Active únicamente la visualización del marco.
- Ajuste en las propiedades de texto la alineación a la derecha del texto y unas filas alternas.
- Seleccione los valores de medición que deban mostrarse.
Configure los valores de medición. Deje en blanco el nombre de visualización para que automáticamente se utilice el nombre del dispositivo y el nombre del valor de medición.
Haga clic en Guardar, para agregar los valores de medición a la tabla. - Ajuste Mes como agregación.
- Compruebe la distancia del pie de página.
| Tipp | ||
|---|---|---|
| ||
|
| Anker | ||||
|---|---|---|---|---|
|
Los objetos están completamente configurados. Compare su página con el ejemplo.
| Sv translation | |||||||||||||||||||||||||||||||||||||||||||||
|---|---|---|---|---|---|---|---|---|---|---|---|---|---|---|---|---|---|---|---|---|---|---|---|---|---|---|---|---|---|---|---|---|---|---|---|---|---|---|---|---|---|---|---|---|---|
| |||||||||||||||||||||||||||||||||||||||||||||
Esempi di applicazioniIn questo esempio di applicazione, viene creata una pagina di report che mostra il lavoro attivo di tre unità operative nell’ultimo anno. Il report contiene anche un’intestazione e un piè di pagina globali.
Anker |
|
| Anker | ||||
|---|---|---|---|---|
|
- Creare un nuovo report e assegnargli un nome.
- Impostare il periodo del report su ultimo anno.
- Impostare il formato pagina su Formato orizzontale A4.
| Tipp | ||
|---|---|---|
| ||
|
Anker KopfFuss KopfFuss
Intestazione e piè di pagina
| KopfFuss | |
| KopfFuss |
L’intestazione o il piè di pagina vengono compilati nella pagina principale. Per aggiungere e modificare oggetti, Masterseite fare clic sull’icona nel navigatore dei report.
Intestazione
- Impostare gli accenti colorati con l’oggetto Cornici e linee. È necessario un oggetto separato per ciascun colore.
Attivare solo il bordo inferiore dell’oggetto per visualizzare una linea semplice.
Utilizzare l’altezza dell’oggetto per impostare la distanza dalla parte superiore della pagina. Inserire il logo aziendale nell’oggetto immagine.
Piè di pagina
- Delimitare il piè di pagina con una linea.
Nell’oggetto Cornici e linee, attivare solo il bordo superiore dell’oggetto per visualizzare una linea semplice.
Utilizzare l’altezza dell’oggetto per impostare la distanza dalla parte inferiore della pagina. - Inserire il proprio claim aziendale in una casella di testo sul lato destro del piè di pagina.
Impostare il testo con giustificazione a destra. - Posizionare la data nell’angolo in basso a sinistra con l’oggetto Data corrente.
- Inserire il numero di pagina con il numero di pagine totale in un oggetto di testo nell’angolo in basso a destra.
Impostare il testo con giustificazione a destra.
Utilizzare i codici dei contenuti dinamici e inserire ##page / ##pageTotal.
| Tipp | ||
|---|---|---|
| ||
|
| Anker | ||||
|---|---|---|---|---|
|
Passare alla Pagina del report, per aggiungere e modificare gli oggetti di dati.
L’energia attiva è mostrata nella metà superiore della pagina come progressione nel periodo del report. Nella metà inferiore della pagina, i valori mensili vengono riportati sotto forma di tabella.
- Inserire un grafico a linee nella metà superiore della pagina. Disporlo in modo da riempire la larghezza della pagina desiderata.
- Attivare la visualizzazione della barra del titolo e di stato e della cornice.
Inserire il nome del valore misurato come nome dell’oggetto per utilizzarlo come intestazione del diagramma. - Selezionare le letture da visualizzare.
Configurare le letture. Assegnare nomi di visualizzazione e colori diversi e utilizzarli come metodo di disegno.
Fare clic su Salva per aggiungere le letture al grafico. - Attivare la visualizzazione della legenda.
- Controllare la distanza dall’intestazione.
- Inserire una tabella nella metà inferiore della pagina. Disporla in modo da riempire la larghezza della pagina desiderata.
- Attivare solo la visualizzazione della cornice.
- Impostare l’allineamento del testo con giustificazione a destra e le linee alternate nelle proprietà del testo.
- Selezionare le letture da visualizzare.
Configurare le letture. Lasciare vuoto il nome di visualizzazione, in modo da utilizzare automaticamente il nome del dispositivo e della lettura.
Fare clic su Salva per aggiungere le letture alla tabella. - Impostare come aggregazione il mese.
- Controllare la distanza dal piè di pagina.
| Tipp | ||
|---|---|---|
| ||
|
| Anker | ||||
|---|---|---|---|---|
|
Gli oggetti sono completamente configurati. Confrontare la propria pagina con l’esempio.