Versionen im Vergleich

Schlüssel

  • Diese Zeile wurde hinzugefügt.
  • Diese Zeile wurde entfernt.
  • Formatierung wurde geändert.
Kommentar: Mittels Scroll Versions veröffentlicht aus dem Bereich GVH und Version 1.0.
Sv translation
languagede

Anker
oben
oben
Gültig für

GridVis-EditionenSoftware-Plattform


Der Limits-, Events- und Transienten-Report (LET Report) ist spezialisiert auf die Ausgabe von Grenzwertverletzungen (Limits), Ereignissen und Transienten. Dieser Bericht enthält Informationen zu den Messstellen, den Berichtzeitraum, der Anzahl und den Typ der aufgetretenen Anomalien. Um einen Limits-, Events- und Transienten-Report zu erstellen, gehen Sie wie folgt vor:

  1. Öffnen Sie den Baumeintrag Ihres Projektes und klicken Sie mit der rechten Maustaste auf den Eintrag Datenexporte.
  2. Wählen Sie im Kontextmenü die Option Datenexport erstellen aus.
  3. Das Fenster Auswahl der Export-Gruppe öffnet sich. Wählen Sie die Rubrik Spannungsqualität aus und klicken Sie auf die Schaltfläche Weiter.
  4. Wählen Sie im Bereich Empfohlene Exporte den Eintrag Limits Events & Transienten (LET) Report aus und klicken Sie auf die Schaltfläche Konfigurieren.
  5. Wählen Sie die Geräte aus, die in den Export einbezogen werden sollen, und klicken Sie auf die Schaltfläche Weiter.
  6. Legen Sie die Zeitraum-Einstellungen für den Export fest und klicken Sie anschließend auf die Schaltfläche Weiter.
  7. Geben Sie einen Titel für den Report ein und wählen Sie die gewünschten Layouteinstellungen aus. Geben Sie die Nominalwerte ein und
    wählen Sie die gewünschten Abweichungstypen, sowie Report-Funktionalitäten aus. Klicken Sie anschließend auf die Schaltfläche Weiter.
  8. Öffnen Sie das Dropdown-Menü Report Auswahl und wählen Sie eine Vorlage für den Report aus. Klicken Sie anschließend auf die Schaltfläche Weiter.
  9. Definieren Sie mithilfe der farblichen Hervorhebungen die Grenzwerte der Heatmap, indem Sie den gewünschten Grenzwert in das entsprechend eingefärbte Textfeld eintragen. Passen Sie die Gewichtung für das Ranking an und klicken Sie anschließend auf die Schaltfläche Weiter.
  10. Wählen Sie das gewünschte Dateiformat aus. Es stehen die Formate PDF, XLS und XLSX zur Verfügung.
  11. Wählen Sie aus, ob der Datenexport im Web verfügbar seien soll. Geben Sie einen Dateinamen für den Datenexport an und wählen Sie einen Speicherort aus.
  12. Wählen Sie die Dateiaktion für den Export aus. Sollte die Datei bereits existieren, können Sie diese überschreiben oder das Erstellungsdatum und die Zeit anhängen, um eine neue Datei zu erstellen. 
  13. Wählen Sie im Bereich Datenexport erstellen aus, ob der Datenexport direkt erstellt werden soll. Klicken Sie abschließend auf die Schaltfläche Fertig.


Info
titleInfo

Sie können den Export jederzeit ausführen. Öffnen Sie dazu den Baumeintrag Datenexporte und klicken Sie mit der rechten Maustaste auf den zuvor konfigurierten Report. Wählen Sie im Kontextmenü die Option Datenexport ausführen. Über die Option Datenexport editieren können Sie die Konfiguration des zuvor erstellten Datenexports ändern.


Sv translation
languageen

Anker
oben
oben
Valid for

GridVis EditionsSoftware platform


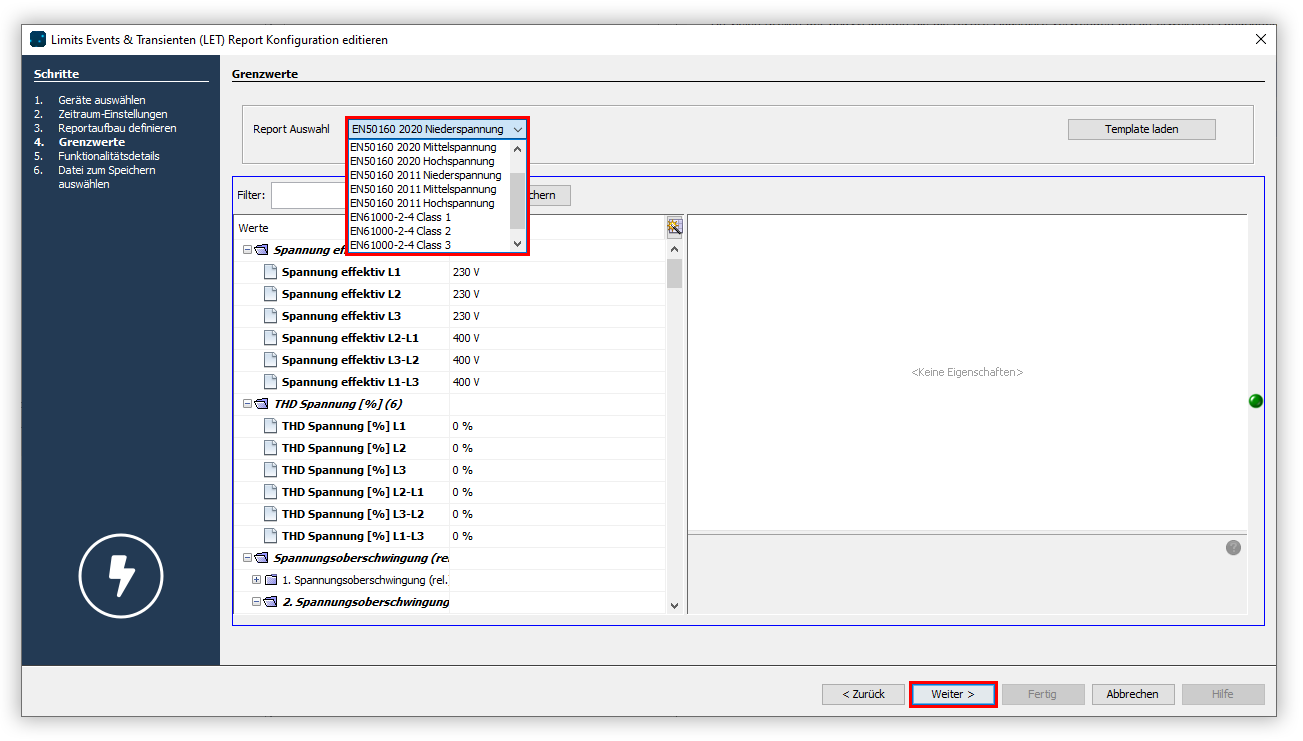
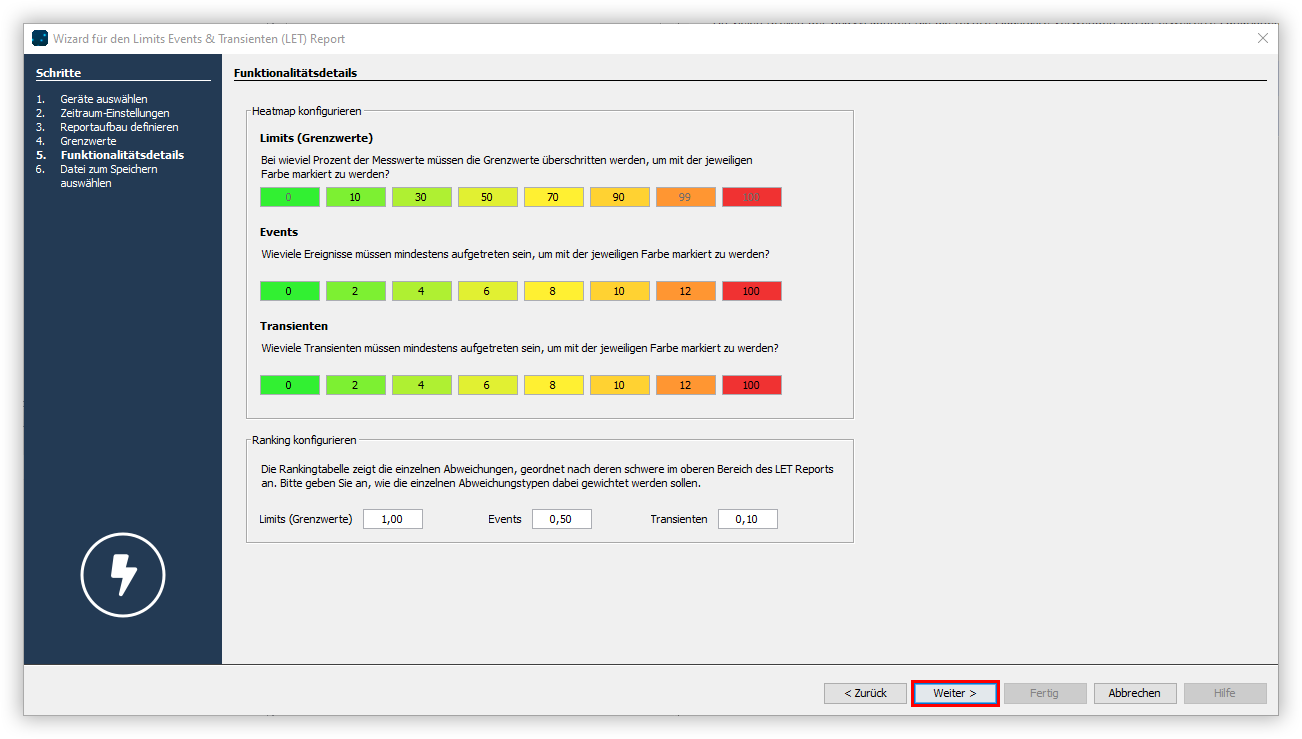
The Limits, Events and Transients Report (LET Report) is specialized for the output of limit violations (limits), events and transients. This report contains information on the measurement points, the reporting period, and the number and type of anomalies that occurred. Proceed as follows to create a limits, events and transients report:

  1. Open the tree item of your project and right-click on the item Data exports.
  2. In the context menu, choose the option Create data export.
  3. The Choose export groups window opens. Select the category Power quality and click the Next button.
  4. In the section Recommended exports, select the item Limits Events & Transients (LET) Report and click the Configure button.
  5. Choose the devices to be included in the export and click the Next button.
  6. Set the Time Period Settings for the export and then click the Next button.
  7. Enter a title for the report and select the desired layout settings. Enter the nominal values and
    select the desired deviation types, as well as report functionalities. Then click the Next button.
  8. Open the Choose report drop-down menu and select a template for the report. Then click the Next button.
  9. Using the colored highlights, define the limits of the heat map by entering the desired threshold in the correspondingly colored text box. Adjust the weighting for the ranking and then click the Next button.
  10. Choose the desired File format. The PDF, XLS and XLSX formats are available.
  11. Choose whether the data export should be available on the web. Specify a file name for the data export and select a storage location.
  12. Choose the File action for the export. If the file already exists, you can overwrite it or append the creation date and time to create a new file.
  13. In the section Create data export, choose whether the data export should be created immediately. Finally, click the Finish button.


Info
titleInfo

You can run the export at any time. To do so, open the tree item Data exports and right-click on the previously configured report. In the context menu, select the option Execute data export. Use the option Edit data export to change the configuration of the previously created data export.


Sv translation
languagees

Anker
oben
oben
Válido para

Ediciones de GridVisPlataforma de software


El informe de límites, eventos y transitorios (informe LET) está especializado en la emisión de violaciones de los valores límite (límites), eventos y transitorios. Este informe contiene informaciones acerca de los puntos de medición, del periodo de tiempo del informe, así como de la cantidad y del tipo de las anomalías ocurridas. Para crear un informe de límites, eventos y transitorios, proceda de la siguiente manera:

  1. Abra la entrada de árbol de su proyecto y haga clic con el botón derecho del ratón en la entrada Exportaciones de datos.
  2. En el menú contextual, seleccione la opción Crear exportación de datos.
  3. Se abre la ventana Selección del grupo de exportación. Seleccione la sección Calidad de la tensióny haga clic en el botón Siguiente.
  4. En la sección Exportaciones recomendadas, seleccione la entrada Informe de límites, eventos y transitorios (LET) y haga clic en el botón Configurar.
  5. Seleccione los dispositivos que deben incluirse en la exportación y haga clic en el botón Siguiente.
  6. Establezca los ajustes del periodo de tiempo para la exportación y, a continuación, haga clic en el botón Siguiente.
  7. Introduzca un título para el informe y seleccione los ajustes de diseño deseados. Introduzca los valores nominales y
    seleccione los tipos de desviación deseados, así como las funcionalidades del informe. A continuación, haga clic en el botón Siguiente.
  8. Abra el menú desplegable Selección informe y seleccione una plantilla para el informe. A continuación, haga clic en el botón Siguiente.
  9. Defina los valores límite del mapa de calor con ayuda de los resaltados de color, introduciendo el valor límite deseado en el campo de texto con el color correspondiente. Adapte la ponderación para el ranking y, a continuación, haga clic en el botón Siguiente.
  10. Seleccione el Formato de archivo deseado. Están disponibles los formatos PDF, XLS y XLSX.
  11. Seleccione si la exportación de datos debe estar disponible en la versión web. Introduzca un nombre de archivo para la exportación de datos y seleccione una ubicación.
  12. Seleccione la acción de archivo para la exportación. En el caso de que el archivo ya exista, podrá sobrescribirlo o añadir la fecha y la hora de creación para crear un nuevo archivo. 
  13. Seleccione en la sección Crear exportación de datos si la exportación de datos debe crearse directamente. Para finalizar, haga clic en el botón Finalizar.


Info
titleInformación

Usted puede ejecutar la exportación en cualquier momento. A tal efecto, abra la entrada de árbol Exportaciones de datos y con el botón derecho del ratón haga clic en el informe anteriormente configurado. En el menú contextual, seleccione la opción Ejecutar exportación de datos. A través de la opción Editar exportación de datos podrá modificar la configuración de la exportación de datos anteriormente creada.


Sv translation
languageit

Anker
oben
oben
Valido per

Edizioni GridVisPiattaforma software


Il report limiti eventi e transitori (LET) segnala superamenti di soglie (Limits), eventi e transitori. Questo report contiene informazioni sui punti di misura, sul periodo di riferimento, sul numero e sul tipo di anomalie verificatesi. Per creare un report limiti, eventi e transitori, procedere come segue:

  1. Aprire la voce della struttura del progetto e fare clic con il tasto destro su Esportazioni dati.
  2. Nel menu contestuale, selezionare l'opzione Crea esportazione dati.
  3. Si apre la finestra Seleziona gruppo di esportazione. Selezionare la rubrica Qualità della tensione e fare clic sul pulsante Avanti.
  4. Nell'area Esportazioni consigliate, selezionare Report limiti, eventi e transitori (LET) e fare clic sul pulsante Configura.
  5. Selezionare i dispositivi da includere nell'esportazione e fare clic sul pulsante Avanti.
  6. Configurare le Impostazioni del periodo di tempo per l’esportazione, quindi fare clic sul pulsante Avanti.
  7. Inserire un titolo per il report e selezionare le impostazioni di layout. Inserire i valori nominali e
    selezionare i tipi di deviazione desiderati oltre alle funzioni di report. Cliccare, quindi fare clic sul pulsante Avanti.
  8. Aprire il menu a discesa Selezione report e selezionare un modello per il report. Cliccare, quindi fare clic sul pulsante Avanti.
  9. Utilizzare le evidenziazioni colorate per definire le soglie della heatmap inserendo la soglia desiderata nel campo di testo colorato corrispondente. Regolare la ponderazione per la classifica quindi cliccare sul pulsante Avanti.
  10. Selezionare il Formato file desiderato. Sono disponibili i formati PDF, XLS e XLSX.
  11. Scegliere se l'esportazione dei dati deve essere disponibile sul web. Specificare un nome file per l'esportazione dei dati e selezionare una posizione di archiviazione.
  12. Selezionare l’azione file per l’esportazione. Se il file esiste già, è possibile sovrascriverlo o aggiungere la data e l'ora di creazione per crearne uno nuovo.
  13. Nell’area Crea esportazione dati, scegliere se l'esportazione dei dati deve essere creata direttamente. Infine, fare clic sul pulsante Fatto.


Info
titleInfo

È possibile effettuare l'esportazione in qualsiasi momento. Per farlo, aprire la voce della struttura Esportazione dati e fare clic con il tasto destro sul report precedentemente configurato. Nel menu contestuale, selezionare l'opzione Esegui esportazione dati. Tramite l'opzione Modifica esportazione dati è possibile modificare la configurazione dell'esportazione di dati creata precedentemente.