Versionen im Vergleich

Schlüssel

  • Diese Zeile wurde hinzugefügt.
  • Diese Zeile wurde entfernt.
  • Formatierung wurde geändert.
Kommentar: Mittels Scroll Versions veröffentlicht aus dem Bereich GVH und Version 1.0.
Sv translation
languagede

Scroll Ignore
scroll-viewporttrue
scroll-pdftrue
scroll-officetrue
scroll-chmtrue
scroll-docbooktrue
scroll-eclipsehelptrue
scroll-epubtrue
scroll-htmltrue
Layout-Box
floatingleft
Linchpin Teaser
iconlinchpin-teaser-icon-play-circle
varianticon
width150px
aligncenter
titleTUTORIAL
type6
newTabtrue
urlhttps://www.youtube.com/playlist?list=PLw-sEKjCcjRxtZkCHa6cAGx2m8AvXDwcv
height150px

Scroll Only
scroll-viewporttrue
scroll-pdftrue
scroll-officetrue
scroll-chmtrue
scroll-docbooktrue
scroll-eclipsehelptrue
scroll-epubtrue
scroll-htmltrue


Anker
DashboardverwaltungOeffnen
Öffnen der Dashboardverwaltung

  • Klicken Sie in der Menüleiste auf die Schaltfläche Dashboards.
  • Klicken Sie im Navigationsmenü auf den Eintrag Dashboards.

Anker
Dashboardverwaltung
Dashboardverwaltung
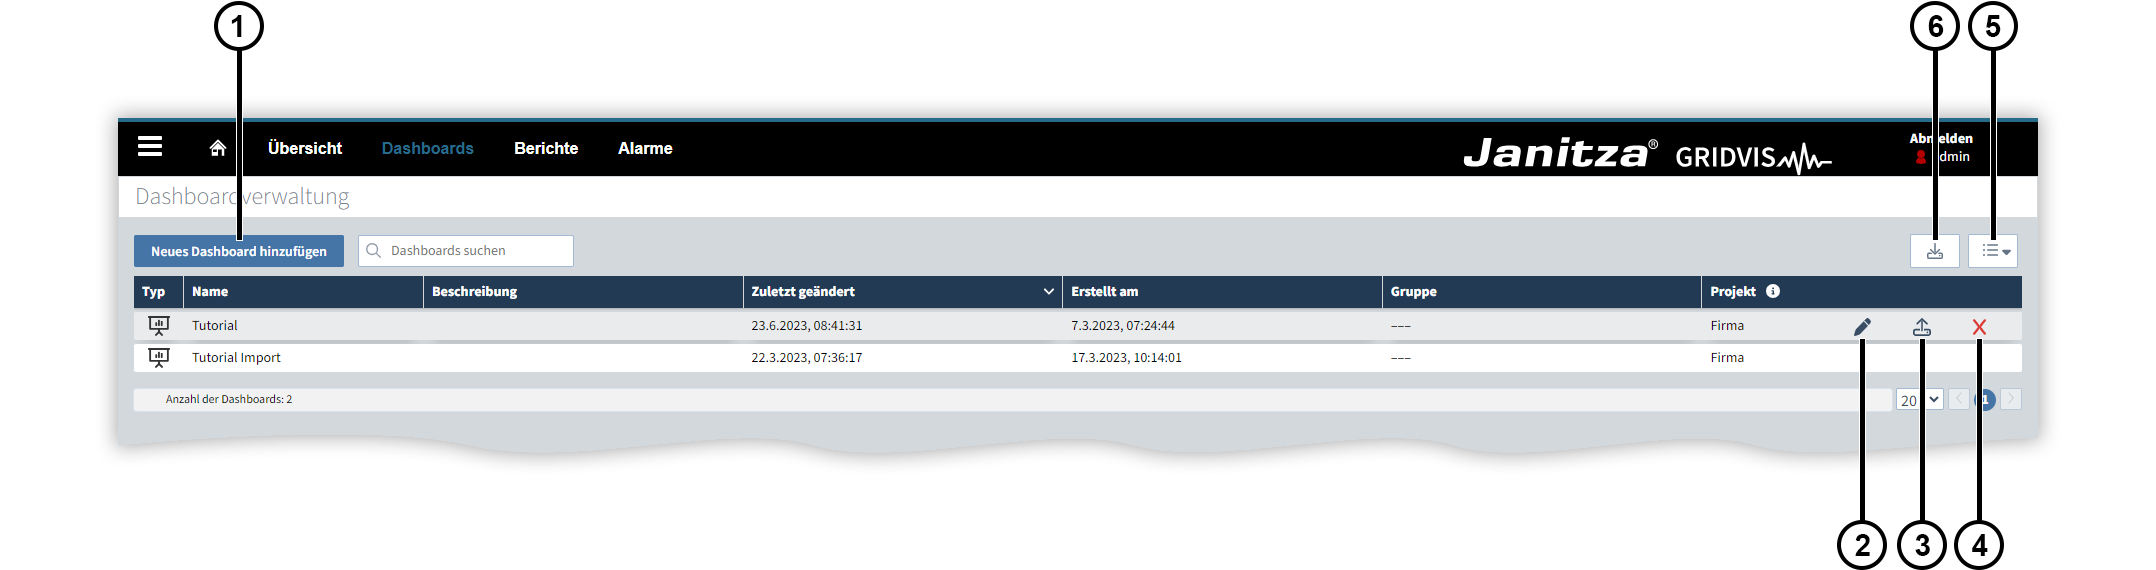
Dashboardverwaltung

In der Dashboardverwaltung werden die Dashboards aus allen Projekten angezeigt, die der GridVis®-Web hinzugefügt wurden.

Folgende Funktionen stehen Ihnen zur Verfügung:

  1. Ein neues Dashboard hinzufügen.
  2. Ein bestehendes Dashboard bearbeiten.
  3. Ein bestehendes Dashboard exportieren. Ein Dashboard wird im JSON-Format gespeichert.
  4. Ein bestehendes Dashboard löschen.
  5. Ansicht ändern. Hier blenden Sie die Dashboards früherer GridVis®-Versionen ein oder rufen die frühere grafische Oberfläche auf (siehe Dashboards und Templates bis GridVis®-Version 9.0.0).
  6. Ein Dashboard importieren. Unterstützt wird der Import von Dashboards im JSON-Format.

Anker
Dashboardeditor
Dashboardeditor
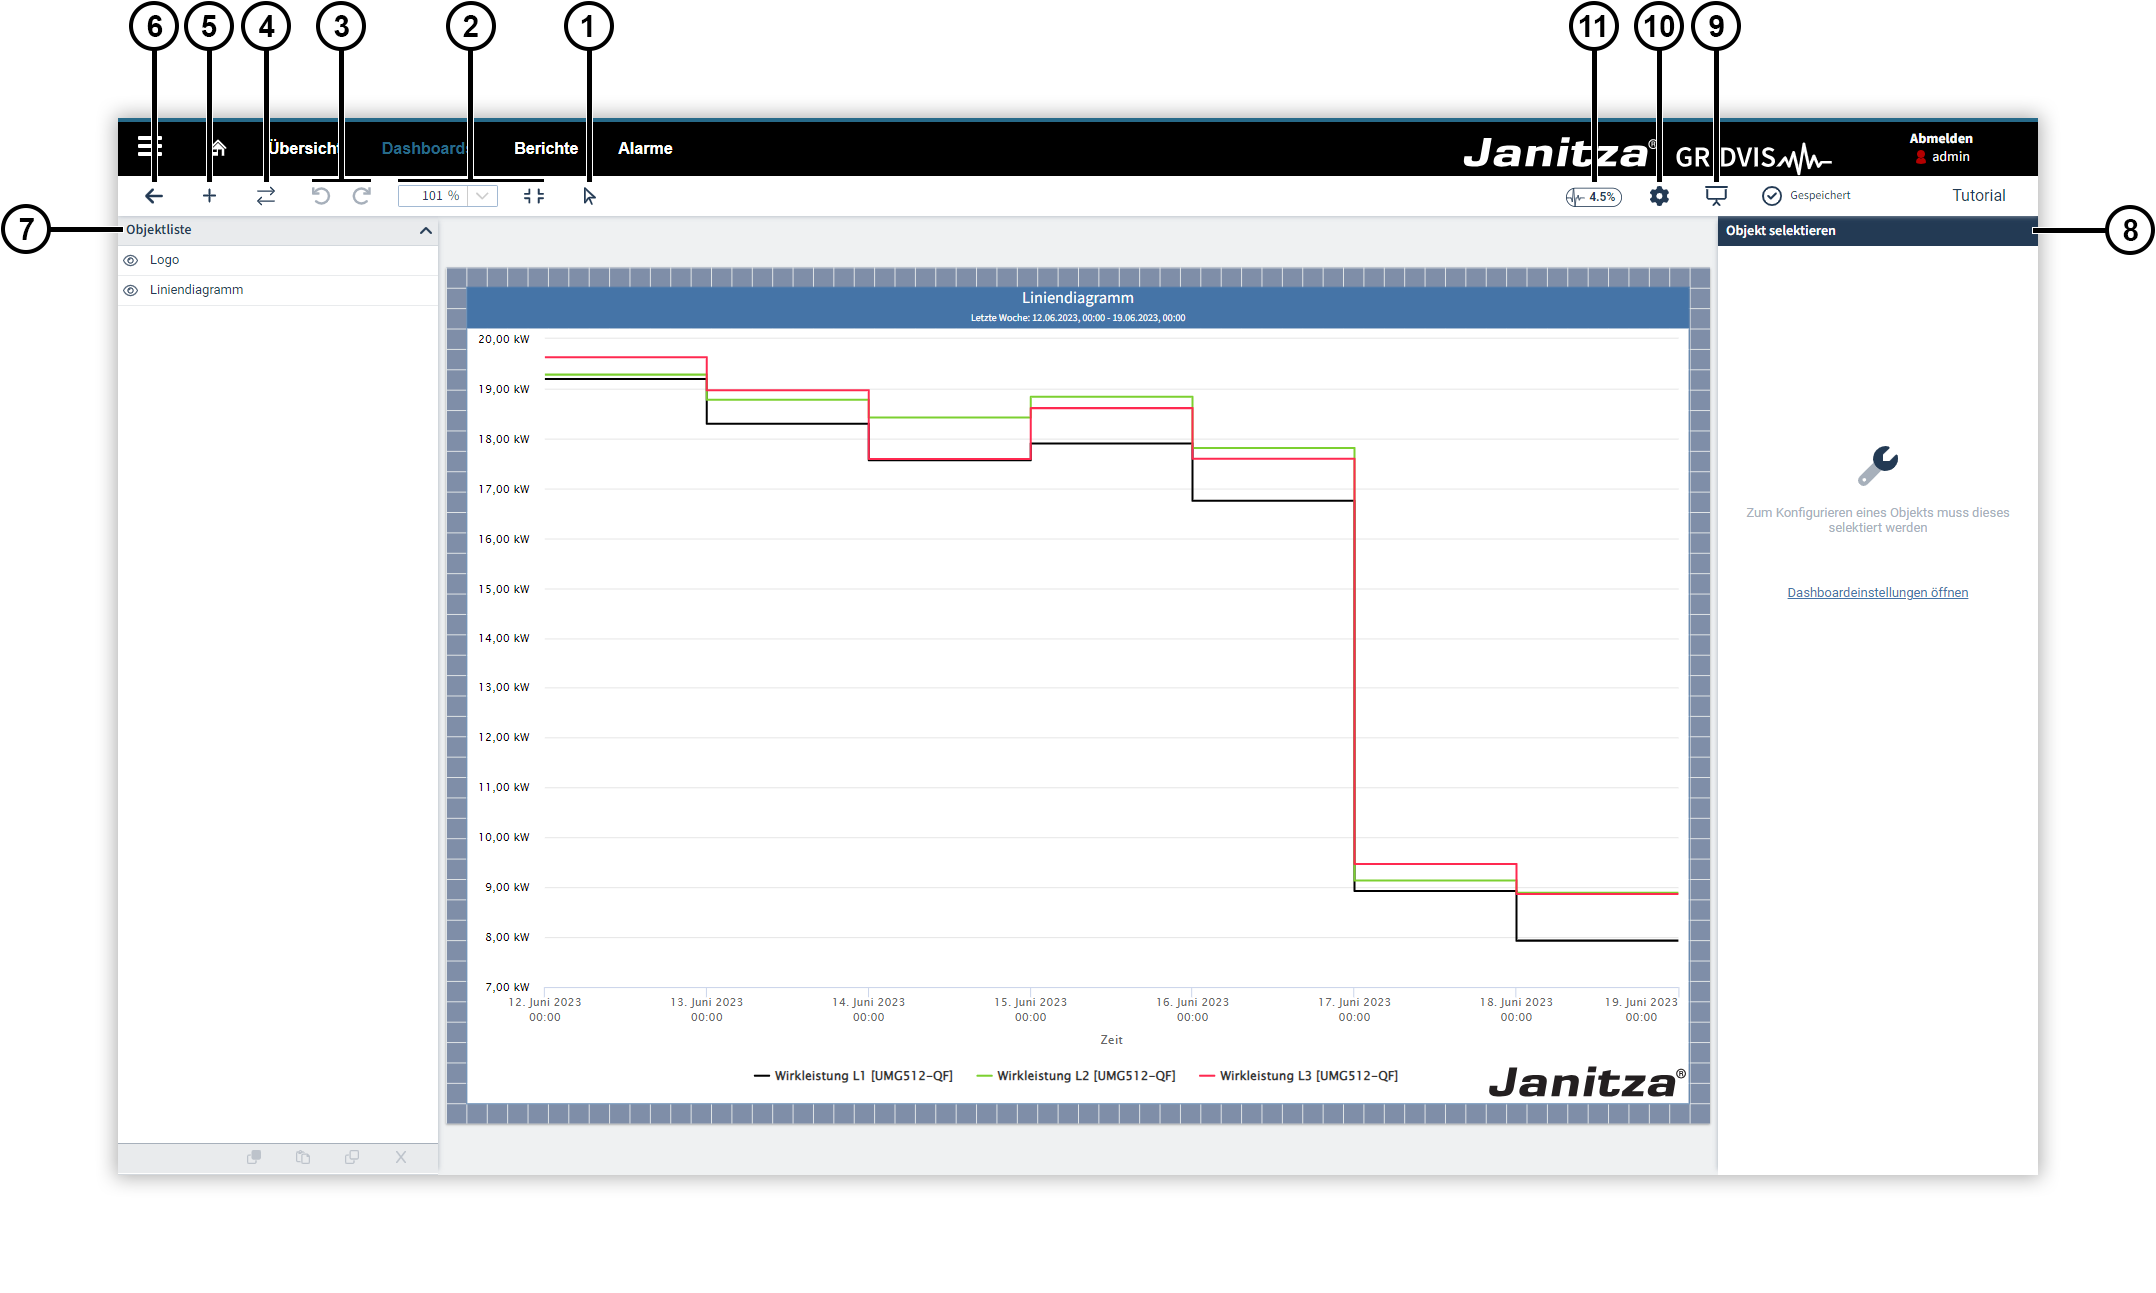
Dashboardeditor

Mit dem Dashboardeditor können Sie Dashboards mit eigenem Layout, Inhalt und Design erstellen.
Platzieren Sie frei Elemente mit Messwerten, Bildern oder graphischen Komponenten. Diese Elemente werden als Objekte bezeichnet.

Folgende Funktionen stehen Ihnen zur Verfügung:

  1. Panning Modus umschalten. Das Maussymbol zeigt an, dass Sie Objekte auf dem Dashboard bewegen. Das Handsymbol bedeutet, dass Sie im Editor navigieren.
  2. Im Dashboard zoomen bzw. das Dashboard an die Fenstergröße anpassen, sodass es die Arbeitsfläche vollständig ausfüllt.
  3. Arbeitsschritte rückgängig machen bzw. wiederherstellen.
  4. Mithilfe des Gerätetauschs Geräte in allen Objekten austauschen.
  5. Objektbibliothek öffnen, um dem Dashboard Objekte hinzuzufügen.
  6. Zur Dashboardverwaltung wechseln.
  7. Objekte verwalten. Sie können Objekte kopieren, duplizieren, einfügen und löschen. Per Drag-and-drop können Sie die Stapelreihenfolge der Objekte ändern. Halten Sie die Strg- bzw. Cmd- Taste gedrückt, um mehrere Objekte gleichzeitig auszuwählen.
  8. Einstellungen ändern. In diesem Fenster werden die Dashboardeinstellungen und die Einstellungen ausgewählter Objekte angezeigt.
  9. Den Präsentationsmodus des Dashboards aufrufen.
  10. Die Dashboardeinstellungen öffnen.
  11. Die aktuellen Auslastung des Dashboards einsehen.

Anker
Dashboardeinstellungen

Treffen Sie die globalen Einstellungen für Ihr Dashboard.

Folgende Funktionen stehen Ihnen zur Verfügung:

  1. Dashboard. Sie können hier einen Namen und eine Beschreibung vergeben und die Hintergrundfarbe des Dashboards ändern. Zusätzlich können Sie hier deaktivieren, dass bei zu starker Auslastung keine weiteren Objekte hinzugefügt werden können. Das Abschalten der Begrenzung kann negative Auswirkungen auf die Performance haben.
  2. Zeitauswahl. Treffen Sie hier die globalen Einstellungen für Live- und historische Werte.
  3. Format. Stellen Sie hier das Format des Dashboards und die Rastergröße ein. Sie können die Anzeige des Rasters deaktivieren. Das Raster dient als Positionierungshilfe und wird im Präsentationsmodus nicht angezeigt.
  4. Objektfarben. Stellen Sie hier die Hintergrund-, Text- und Rahmenfarbe der Objekte des Dashboards ein.

Anker
Praesentationsmodus
Praesentationsmodus
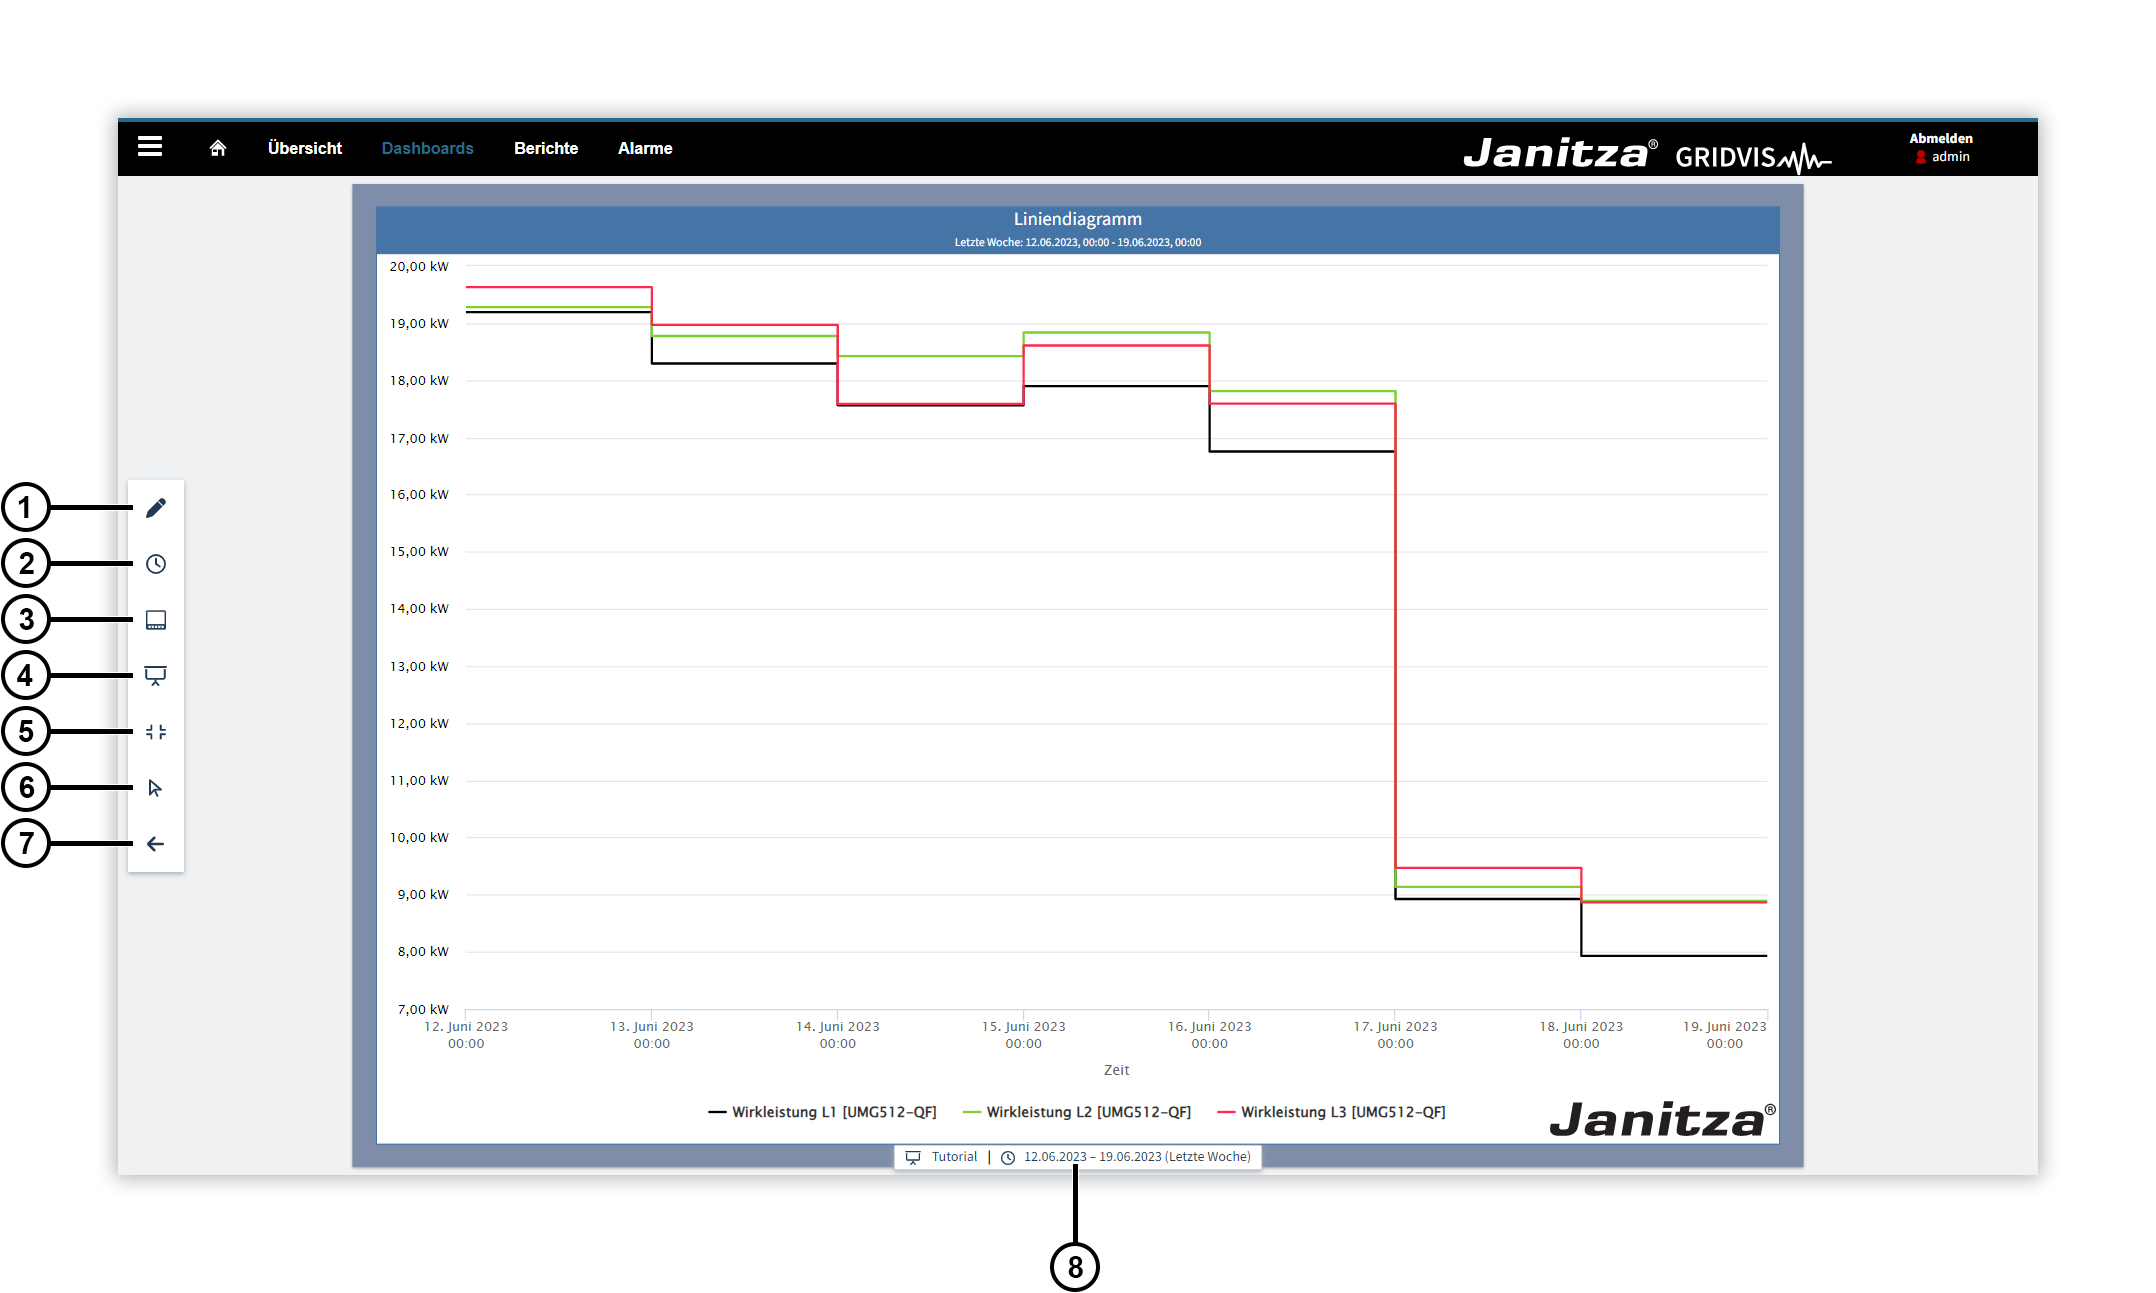
Präsentationsmodus

Der Präsentationsmodus dient zur Anzeige des Dashboards z. B. auf einem separaten Monitor.

Folgende Funktionen stehen Ihnen zur Verfügung:

  1. Zum Dashboardeditor wechseln.
  2. Zeiteinstellung ändern. Während der Präsentation des Dashboards können Sie die Einstellungen der angezeigten Zeit ändern. Diese Änderung gilt für die Dauer der Präsentation für alle Objekte des Dashboards und wird zurückgesetzt, sobald Sie den Präsentationsmodus verlassen. In den Objekteinstellungen können Sie einzelne Objekte von einer Änderung der angezeigten Zeit ausnehmen.
  3. Geräte tauschen. Während der Präsentation des Dashboards können Sie das verwendete Gerät ändern. Diese Änderung gilt für die Dauer der Präsentation für alle Objekte des Dashboards und wird zurückgesetzt, sobald Sie den Präsentationsmodus verlassen. In den Objekteinstellungen können Sie einzelne Objekte von einer Änderung des verwendeten Geräts ausnehmen.
  4. Ein anderes Dashboard öffnen. Sie können ein anderes Dashboard aus Ihren Projekten im Präsentationsmodus anzeigen.
  5. Das Dashboard an die Fenstergröße anpassen, sodass es den Anzeigebereich vollständig ausfüllt.
  6. Panning Modus umschalten. Das Maussymbol zeigt an, dass Sie mit den Objekten auf dem Dashboard interagieren. Das Handsymbol bedeutet, dass Sie im Präsentationsmodus navigieren.
  7. Zur Dashboardverwaltung wechseln.
  8. Informationen zum Dashboard anzeigen. Hier sehen Sie, welches Dashboard mit welcher Zeiteinstellung präsentiert wird. Sie können zudem temporäre Änderungen der Zeiteinstellung oder getauschte Geräte zurücksetzen.
Sv translation
languageen

Scroll Ignore
scroll-viewporttrue
scroll-pdftrue
scroll-officetrue
scroll-chmtrue
scroll-docbooktrue
scroll-eclipsehelptrue
scroll-epubtrue
scroll-htmltrue
Layout-Box
floatingleft
Linchpin Teaser
iconlinchpin-teaser-icon-play-circle
varianticon
width150px
aligncenter
titleTUTORIAL
type6
newTabtrue
urlhttps://www.youtube.com/playlist?list=PLw-sEKjCcjRxEO16D6FZQkp9fzdpXNNwI
height150px

Scroll Only
scroll-viewporttrue
scroll-pdftrue
scroll-officetrue
scroll-chmtrue
scroll-docbooktrue
scroll-eclipsehelptrue
scroll-epubtrue
scroll-htmltrue


Anker
DashboardverwaltungOeffnen
Opening the dashboard management

  • Click on the Dashboards button in the menu bar.
  • In the Navigation menu, click on the entry Dashboards.

Anker
Dashboardverwaltung
Dashboardverwaltung
Dashboard management

The dashboard management displays the dashboards from all projects that have been added to the GridVis® Web.

The following functions are available:

  1. Add Dashboard for a new dashboard.
  2. Edit Dashboard to edit an existing dashboard.
  3. Export Dashboard to export an existing dashboard. A dashboard is saved in the JSON format.
  4. Delete Dashboard to delete an existing dashboard.
  5. Change view. Here you can display the dashboards of previous GridVis® versions or open the previous graphical interface (see Dashboards and Templates up to GridVis® version 9.0.0).
  6. Import Dashboard to import a dashboard. This function supports dashboard imports in the JSON format.

Anker
Dashboardeditor
Dashboardeditor
Dashboard editor

The dashboard editor allows you to create dashboards with your own layout, content and design.
Freely place elements with measured values, images or graphical components. These elements are called Objects.

The following functions are available:

  1. Switch panning mode. The mouse icon indicates that you are moving objects on the dashboard. The hand symbol means that you are navigating in the editor.
  2. In the dashboard you can Zoom or resize it to Fit the dashboard to window size so that it completely fills the workspace.
  3. You can Undo or Redo work steps.
  4. Use the Device exchange feature to replace devices in all objects.
  5. Use Open object library to add objects to the dashboard.
  6. Got to the Dashboard management.
  7. Manage objects. You can copy, duplicate, insert and delete objects. You can change the order of the objects in the stack using drag and drop. Hold down the Ctrl or Cmd key to select multiple objects at the same time.
  8. Change settings. This window displays the Dashboard settings as well as the settings of objects that are selected.
  9. Open the Presentation mode of the dashboard.
  10. Open the Dashboard settings.
  11. View the current Dashboard workload.

Anker
Dashboardeinstellungen
Dashboard settings

Make the global settings for your dashboard.

The following functions are available:

  1. Dashboard. You can assign a name and description here and change the background color of the dashboard. In addition, you can deactivate the setting here that prevents further objects from being added if the workload is too high. Turning off this limitation can have a negative impact on the performance.
  2. Time selection. Make the global settings for live and historical values here.
  3. Format. Set the format of the dashboard and the grid size here. You can disable the display of the grid. The grid is used as a positioning aid and is not displayed in presentation mode.
  4. Objekt colors. Set the background, text and border color of the dashboard objects here.

Anker
Praesentationsmodus
Praesentationsmodus
Presentation mode

The presentation mode is used to display the dashboard elsewhere, for example on a separate monitor.

The following functions are available:

  1. Got to the Dashboard editor.
  2. Change time setting. During the dashboard presentation you can change the settings of the displayed time. This change applies to all objects in the dashboard for the duration of the presentation and is reset as soon as you exit presentation mode. In the object settings, you can exclude individual objects from having the displayed time changed.
  3. Replace devices. During the dashboard presentation you can change the device used. This change applies to all objects in the dashboard for the duration of the presentation and is reset as soon as you exit presentation mode. In the object settings, you can exclude individual objects from having the device used changed.
  4. Open another dashboard. You can view another dashboard from your projects in the presentation mode.
  5. Use Fit the dashboard to the window size so that it completely fills the display area.
  6. Switch panning mode. The mouse icon indicates that you are interacting with the objects on the dashboard. The hand icon means that you are navigating in presentation mode.
  7. Go to the Dashboard management.
  8. Show Dashboard Information. This shows which dashboard is being presented with which time setting. You can also reset temporary time setting changes or swapped devices.
Sv translation
languageit

Scroll Ignore
scroll-viewporttrue
scroll-pdftrue
scroll-officetrue
scroll-chmtrue
scroll-docbooktrue
scroll-eclipsehelptrue
scroll-epubtrue
scroll-htmltrue
Layout-Box
floatingleft
Linchpin Teaser
iconlinchpin-teaser-icon-play-circle
varianticon
width150px
aligncenter
titleTUTORIAL
type6
newTabtrue
urlhttps://www.youtube.com/playlist?list=PLw-sEKjCcjRxEO16D6FZQkp9fzdpXNNwI
height150px

Scroll Only
scroll-viewporttrue
scroll-pdftrue
scroll-officetrue
scroll-chmtrue
scroll-docbooktrue
scroll-eclipsehelptrue
scroll-epubtrue
scroll-htmltrue


Anker
DashboardverwaltungOeffnen
Apertura di Dashboard manager (Gestione dashboard)

  • Fare clic sul pulsante nella barra del menu Dashboard.
  • Fare clic nel Menu di navigazione sulla voce Dashboard.

Anker
Dashboardverwaltung
Dashboardverwaltung
Dashboard manager (Gestione dashboard)

La gestione dashboard mostra le dashboard di tutti i progetti aggiunti a GridVis® Web.

Sono disponibili le seguenti funzioni:

  1. La voce Add new dashboard (aggiungi nuova dashboard).
  2. L’icona Modifica dashboard esistente.
  3. L’icona Esporta dashboard esistente. Le dashboard vengono memorizzate in formato JSON.
  4. L’icona Elimina dashboard esistente.
  5. Cambia vista. Qui è possibile visualizzare le dashboard delle versioni precedenti di GridVis® o aprire l'interfaccia grafica precedente (vedere Dashboard e template fino alla versione 9.0.0 di GridVis®).
  6. Importare una dashboard. È supportata l'importazione di dashboard in formato JSON.

Anker
Dashboardeditor
Dashboardeditor
Editor di dashboard

Con l'editor di dashboard è possibile creare dashboard con layout, contenuti e design personalizzati.
Posizionare liberamente gli elementi con letture, immagini o componenti grafici. Questi elementi sono chiamati oggetti.

Sono disponibili le seguenti funzioni:

  1. Passare alla modalità panning. L'icona del mouse indica che si stanno spostando oggetti sulla Dashboard. Il simbolo della mano indica che si sta navigando nell'editor.
  2. Zoomare nella dashboard o Adattare la dashboard alle dimensioni della finestra, in modo da riempire completamente la superficie di lavoro.
  3. Annullare o Ripristinare i passaggi di lavoro.
  4. Utilizzare la funzione Scambio dispositivi per scambiare i dispositivi in tutti gli oggetti.
  5. Aprire la libreria oggetti, per aggiungere oggetti alla dashboard.
  6. Passare a Dashboard manager (gestione dashboard).
  7. Gestione oggetti. Qui è possibile copiare, duplicare, incollare ed eliminare oggetti. È possibile modificare l’ordine di impilamento degli oggetti mediante trascinamento. Tenendo premuto il tasto Ctrl o cmd è possibile selezionare più oggetti contemporaneamente.
  8. Modificare le impostazioni. Questa finestra mostra le Dashboard settings (impostazioni delle dashboard) e vengono visualizzate le impostazioni degli oggetti selezionati.
  9. Aprire la Modalità di presentazione della Dashboard.
  10. Aprire le Impostazioni della dashboard.
  11. Visualizzare l’utilizzo attuale della dashboard.

Anker
Dashboardeinstellungen
Impostazioni delle dashboard

Configurare le impostazioni globali della Dashboard.

Sono disponibili le seguenti funzioni:

  1. Dashboard. Qui è possibile assegnare un nome e una descrizione e modificare il colore di sfondo della Dashboard. Inoltre, è possibile disattivare la possibilità di aggiungere altri oggetti se il carico di lavoro è eccessivo. La disattivazione della limitazione può avere effetti negativi sulle prestazioni.
  2. Time selection (selezione del tempo). Configurare qui le impostazioni globali dei valori in tempo reale e storici.
  3. Format (Formato). Impostare qui il formato della dashboard e la dimensione della griglia. È possibile disattivare la visualizzazione della griglia. La griglia serve come aiuto per il posizionamento e non viene visualizzata nella modalità di presentazione.
  4. Object colors (Colori degli oggetti). Impostare qui il colore dello sfondo, del testo e della cornice degli oggetti della dashboard.

Anker
Praesentationsmodus
Praesentationsmodus
Modalità di presentazione

La modalità di presentazione viene utilizzata per visualizzare la dashboard, ad esempio su un monitor separato.

Sono disponibili le seguenti funzioni:

  1. Passare all’Editor di Dashboard.
  2. Modificare le impostazioni dell’ora. Durante la presentazione della dashboard, è possibile modificare le impostazioni dell'ora visualizzata. Questa modifica si applica a tutti gli oggetti della Dashboard per tutta la durata della presentazione e viene ripristinata non appena si esce dalla modalità di presentazione. Nelle impostazioni degli oggetti è possibile escludere singoli oggetti dalla modifica dell'ora visualizzata.
  3. Scambia dispositivi. Durante la presentazione della dashboard, è possibile cambiare il dispositivo utilizzato. Questa modifica si applica a tutti gli oggetti della Dashboard per tutta la durata della presentazione e viene ripristinata non appena si esce dalla modalità di presentazione. Nelle impostazioni dell'oggetto, è possibile escludere singoli oggetti da una modifica del dispositivo utilizzato.
  4. Aprire una dashboard diversa. È possibile visualizzare un'altra dashboard dai progetti in modalità presentazione.
  5. Adattare la dashboard alle dimensioni della finestra in modo che riempia completamente l'area di visualizzazione.
  6. Passare alla modalità panning. L'icona del mouse indica che si sta interagendo con gli oggetti della Dashboard. Il simbolo della mano indica che si sta navigando in modalità presentazione.
  7. Passare a Dashboard manager (gestione dashboard).
  8. Visualizzare le Informazioni sulla dashboard. Qui è possibile vedere quale dashboard viene presentata con quale impostazione dell'ora. È anche possibile ripristinare le modifiche temporanee all'impostazione dell'ora o i dispositivi scambiati.
Sv translation
languagees

Scroll Ignore
scroll-viewporttrue
scroll-pdftrue
scroll-officetrue
scroll-chmtrue
scroll-docbooktrue
scroll-eclipsehelptrue
scroll-epubtrue
scroll-htmltrue
Layout-Box
floatingleft
Linchpin Teaser
iconlinchpin-teaser-icon-play-circle
varianticon
width150px
aligncenter
titleTUTORIAL
type6
newTabtrue
urlhttps://www.youtube.com/playlist?list=PLw-sEKjCcjRxEO16D6FZQkp9fzdpXNNwI
height150px

Scroll Only
scroll-viewporttrue
scroll-pdftrue
scroll-officetrue
scroll-chmtrue
scroll-docbooktrue
scroll-eclipsehelptrue
scroll-epubtrue
scroll-htmltrue


Anker
DashboardverwaltungOeffnen
Abrir la administración de paneles

  • En la barra de menús, haga clic en el botón Paneles.
  • En el menú de navegación, haga clic en la entrada Paneles.

Anker
Dashboardverwaltung
Dashboardverwaltung
Administración de paneles

En la administración de paneles se muestran los paneles de todos los proyectos que se agregaron a GridVis®-Web.

Usted dispone de las siguientes funciones:

  1. Agregar un panel nuevo.
  2. Editar un panel existente.
  3. Exportar un panel existente. Un panel se guarda en el formato JSON.
  4. Borrar un panel existente.
  5. Cambiar la vista. Aquí podrá mostrar los paneles de versiones anteriores de GridVis® o acceder a la interfaz gráfica anterior (véase Paneles y plantillas hasta la versión 9.0.0 de GridVis®).
  6. Importar un panel. Se admite la importación de paneles en el formato JSON.

Anker
Dashboardeditor
Dashboardeditor
Editor de paneles

Con el editor de paneles, usted puede crear paneles con contenido y diseño propios.
Coloque libremente elementos con valores de medición, imágenes o elementos gráficos. Estos elementos se denominan objetos.

Usted dispone de las siguientes funciones:

  1. Conmutar modo panning. El símbolo del ratón indica que usted mueve objetos en el panel. El símbolo de la mano significa que usted navega en el editor.
  2. Ampliar o reducir la representación en el panel o adaptar el panel al tamaño de la ventana, de modo que llene completamente la superficie de trabajo.
  3. Deshacer o rehacer pasos de trabajo.
  4. Sustituir dispositivos en todos los objetos con ayuda de la sustitución de dispositivos.
  5. Abrir la biblioteca de objetos para agregar objetos al panel.
  6. Cambiar a la administración de paneles.
  7. Administrar objetos. Usted puede copiar, duplicar, insertar y borrar objetos. Mediante la función de arrastrar y soltar podrá cambiar el orden de superposición de los objetos. Mantenga pulsada la tecla Ctrl o Cmd para seleccionar simultáneamente varios objetos.
  8. Cambiar los ajustes. En esta ventana se muestran los ajustes del panel y los ajustes de los objetos seleccionados.
  9. Acceder al modo de presentación del panel.
  10. Abrir losajustes del panel.
  11. Ver el grado de utilización actual del panel.

Anker
Dashboardeinstellungen
Ajustes del panel

Realice los ajustes globales para su panel.

Usted dispone de las siguientes funciones:

  1. Panel. Aquí podrá asignar un nombre y una descripción, y modificar el color de fondo del panel. Adicionalmente, aquí podrá desactivar que no se agreguen objetos adicionales en el caso de un elevado grado de utilización. La desactivación de la limitación puede afectar negativamente al rendimiento.
  2. Selección de tiempo. Realice aquí los ajustes globales para los valores en tiempo real y los valores históricos.
  3. Formato. Ajuste aquí el formato del panel y el tamaño de cuadrícula. Usted puede desactivar la visualización de la cuadrícula. La cuadrícula se utiliza como ayuda de posicionamiento y no se muestra en el modo de presentación.
  4. Colores de objeto. Ajuste aquí el color de fondo, el color del texto y el color del marco de los objetos del panel.

Anker
Praesentationsmodus
Praesentationsmodus
Modo de presentación

El modo de presentación se utiliza para la indicación del panel, p. ej., en un monitor separado.

Usted dispone de las siguientes funciones:

  1. Cambiar al editor de paneles.
  2. Cambiar el ajuste de la hora. Usted puede cambiar los ajustes de la hora indicada durante la presentación del panel. Este cambio es válido para todos los objetos del panel durante la presentación y se restablece en cuanto usted salga del modo de presentación. En los ajustes de objeto podrá exceptuar objetos individuales de un cambio de la hora indicada.
  3. Sustituir dispositivos. Usted puede cambiar el dispositivo utilizado durante la presentación del panel. Este cambio es válido para todos los objetos del panel durante la presentación y se restablece en cuanto usted salga del modo de presentación. En los ajustes de objeto podrá exceptuar objetos individuales de un cambio del dispositivo utilizado.
  4. Abrir otro panel. Usted puede mostrar otro panel de sus proyectos en el modo de presentación.
  5. Adaptar el panel al tamaño de ventana, de modo que llene completamente el área de visualización.
  6. Conmutar modo panning. El símbolo del ratón indica que usted interactúa con los objetos en el panel. El símbolo de la mano significa que usted navega en el modo de presentación.
  7. Cambiar a la administración de paneles.
  8. Mostrar información acerca del panel. Aquí usted ve qué panel se presenta con qué ajuste de hora. Además, podrá restablecer los cambios temporales del ajuste de hora o de los dispositivos sustituidos.